Announcement

Collapse
No announcement yet.

Bullish Information

Collapse
X
 
  • Filter
  • Time
  • Show
Clear All
new posts

  • bart
    replied
    Re: Bullish Information

    Originally posted by jk View Post
    bart,
    can anything be said quantitatively about the depth of the predicted recession from your chart? or do you see it as just a yes/no prediction? i.e. 1980-82 was brutal, the worst since the 30's, and both of the curves were substantially below zero. 2000 was quite mild, and one of the curves was not far below zero. can we conclude that at this moment the chart predicts a MILD recession?
    Interesting concept jk.

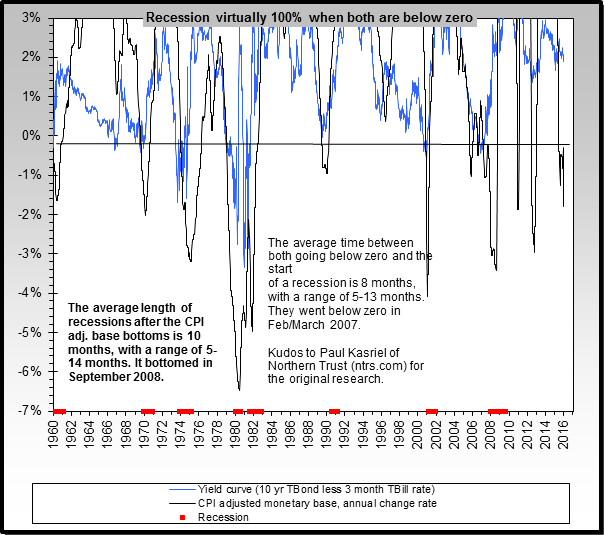
    It was only designed as a yes/no guide, and the various correlations you noted with depth of the recessions and how far below zero the two indicators went wasn't something I'd noticed until you mentioned it.

    The only thing I should point out is that since CPI is involved, and without any adjustments, that blue line is actually off the bottom of the chart (about -6.5%) when shadowstats.com adjustments are taken into account... and it has been negative for well over a year... and there is no historical parallel for that pattern.

    That said, the closest parallel is indeed 2002 with 1970 and 1990 not far behind. A bit more than a mild recession is what I'm expecting... and the depth of it will be determined significantly more by what other central banks do than normal.

    For what its worth, the ECB is showing an inverted yield curve again the last three weeks, and it was inverted for a few weeks in March 2007 too. There's also this - Overheating sees house price downturn in Europe.
    Nothing like "interesting" times...

    Leave a comment:


  • jk
    replied
    Re: Bullish Information

    bart,
    can anything be said quantitatively about the depth of the predicted recession from your chart? or do you see it as just a yes/no prediction? i.e. 1980-82 was brutal, the worst since the 30's, and both of the curves were substantially below zero. 2000 was quite mild, and one of the curves was not far below zero. can we conclude that at this moment the chart predicts a MILD recession?

    Leave a comment:


  • bart
    replied
    Re: Bullish Information

    Originally posted by Jim Nickerson View Post
    I cannot and will not argue with your data if it predicts a recession.
    Drat... where Finster when he's needed... ;)

    Here's the actual chart and the credit mostly belongs with Paul Kasriel of Northern Trust - a major straight shooter in my book.


    Leave a comment:


  • Jim Nickerson
    replied
    Re: Bullish Information

    Originally posted by bart View Post
    There are three things that bother me about Hyman's take.

    1. His vested interest
    2. No mention of the BLS BS on CPI and how it would
    greatly modify his opinions.
    3. My recession prediction chart, which has also never been wrong about a recession and also did not falsely call for a recession in 1995.
    Vested interests always blurr whatever might be truth.

    Bart, I'm of the opinion that those on Wall Street and in the MSM pay no attention publicly to BLS BS or Shadow Government Statistics site. MSM mostly dissiminates misinformation and Wall Street tries to get hold of all OPM.

    I cannot and will not argue with your data if it predicts a recession.

    Leave a comment:


  • bart
    replied
    Re: Bullish Information

    Originally posted by Jim Nickerson View Post
    Nice find, f_j. I think Hyman is well respected and credible, and that is probably from references to him I've crossed in Barron's from time to time.

    There certainly seems to be no gloom in the interview which must last 10+ minutes. Thanks for posting it. I wish more people would put links in these bull and bear threads.

    He sees no recession, and easing by the Fed beginning in September with the rate ending at 4.0%.

    If he's correct, EJ will not be.


    There are three things that bother me about Hyman's take.

    1. His vested interest
    2. No mention of the BLS BS on CPI and how it would
    greatly modify his opinions.
    3. My recession prediction chart, which has also never been wrong about a recession and also did not falsely call for a recession in 1995.

    Leave a comment:


  • Jim Nickerson
    replied
    Re: Bullish Information

    Originally posted by friendly_jacek View Post
    I came across this interesting interview and decided to share it here because it gives a lot of insight into the commercial traders optimism one can see on COT charts these days. It is interesting that I first saw it posted on a bearish blog:
    http://bigpicture.typepad.com/commen....html#comments

    I personally know nothing about Hyman but supposedly he was right every time economy took turns since late 1970s.
    This confirms mu gut feelings that we are seeing a mid to late cycle slowdown rather than a total meltdown. We will have a total meltdow (Ka) but not until the baby boomers age a few more years (IMHO).
    Nice find, f_j. I think Hyman is well respected and credible, and that is probably from references to him I've crossed in Barron's from time to time.

    There certainly seems to be no gloom in the interview which must last 10+ minutes. Thanks for posting it. I wish more people would put links in these bull and bear threads.

    He sees no recession, and easing by the Fed beginning in September with the rate ending at 4.0%.

    If he's correct, EJ will not be.

    Leave a comment:


  • friendly_jacek
    replied
    Re: Bullish Information

    I came across this interesting interview and decided to share it here because it gives a lot of insight into the commercial traders optimism one can see on COT charts these days. It is interesting that I first saw it posted on a bearish blog:
    http://bigpicture.typepad.com/commen....html#comments

    I personally know nothing about Hyman but supposedly he was right every time economy took turns since late 1970s.
    This confirms mu gut feelings that we are seeing a mid to late cycle slowdown rather than a total meltdown. We will have a total meltdow (Ka) but not until the baby boomers age a few more years (IMHO).

    Leave a comment:


  • friendly_jacek
    replied
    Re: Bullish Information

    You can trust Brett. He is a scientist (PhD) with a reputation and not some anonymous blogger. His perspective is mostly short term trading though.

    Leave a comment:


  • Jim Nickerson
    replied
    Re: commercial paper gap

    Originally posted by friendly_jacek View Post
    http://traderfeed.blogspot.com/2007/...ial-paper.html

    Above is a very bullish analysis. The only drawback is that the study extended only to 1980.
    Interesting find, f_j. I wouldn't personally place my bets just on that splurb. When I encounter things like that, it would be nice to either have been collecting such data oneself, or to be able to look at such data on some site. However, if it is at it appears to show, then perhaps now will turn out to be shown as a good buying opportunity.

    Leave a comment:


  • friendly_jacek
    replied
    commercial paper gap

    http://traderfeed.blogspot.com/2007/...ial-paper.html

    Above is a very bullish analysis. The only drawback is that the study extended only to 1980.

    Leave a comment:


  • friendly_jacek
    replied
    Re: Bullish Information

    Jim,
    Looks like you are mostly talking to yourself. Sorry I can't help much but also noticed low volume. This may be a short time top and more selling is possible into the beginning of October. I hope that we will not go below the 8/16 lows. I will add to my equities if we go lower. One of the thoughts I have is that there is a strong division between bears and bulls with quite strong convictions. I.e., bulls are maxed out on their positions (COT for instance) and bears sold out last positions on 8/16. There may not be much volume before new information (good or bad) hits the streets or shorts are squeezed into covering. Also, the outcome of Fed decision is a big unknown (to retail investors at least as insiders and COT are acting like they know already) while the marked is pricing in a rate cut already.

    Leave a comment:


  • Jim Nickerson
    replied
    Re: Bullish Information

    Originally posted by Nickerson, post#168
    I'm not stuck on anything Russell writes as approaching what may be the coming reality, but one thing about Russell is he seems to stick rather much to interpretation of the data from the market as he often says one should in effect "listen to the market." The market "knows" everything.

    Friday 8/24 Russell wrote:
    Quote:
    C, BAC, LEH, WFC, and JPM were all on the most active list and all were up -- bullish.

    The VIX was down 1.90 to 20.72 and clearly has topped out. Bullish.

    CONCLUSION-- The market action today was excellent with the single exception of volume which could have been higher. Of course, you always like stocks rising on expanding volume. My take on volume is that most people are skeptical of this market's rise and are therefore holding back. They can't believe that the market can advance in the face of bad news. Sure reminds me of 1957.

    Upside over downside volume was very bullish as was the PTI action. My PTI never turned bearish on all the recent weakness. That didn't appear rationale at the time, but as I've said so often, "my PTI is smarter than I am."


    I agree with Russell about the poor volume. Friday's NYSE volume was 6.1 on a scale of 0-100 dating back to 4/5/04, and the week's volume 19.2 on same scale and period. It's possible Russell's explanation suffices to account for the poor volume: "My take on volume is that most people are skeptical of this market's rise and are therefore holding back."
    I want to beat this "volume horse" a bit more.

    On the Nasdaq, the volume percent ranks for the weeks ending 7/27, 8/3, 8/10, and 8/17 were 99.4, 98.9, 100, and 97.8 respectively, based on data collection back to 1/2/04. These were really high volume weeks during a quick drop from the highs on 7/19/07.

    On the NSYE, for the same periods as above, the percent ranks were 98.2, 98.8, 100, and 99.4. These were really high volume weeks.

    From 7/19 to 8/17 there were four minus 90% volume and points days, and two more where the points down were minus 90% and the volumes down were minus 87.7% and 85.6%. These panic selling days, I think history will bear out, were indicative of a big-time panic.

    If it is correct that all the high volumes and the frequency of panic selling days meant a lot of individual and some entities were capitulating, how many buyers does that leave to be racking up big volumes since 8/17/07?

    What I am attempting to put forth here to me strongly supports Richard Russell's contention (underlined in his blue quote above).

    If you had your socks scared off over the past month and sold, how quickly will you be to jump back into the long side of equities?

    Leave a comment:


  • Jim Nickerson
    replied
    Re: Bullish Information Request for Help.

    Request for Help.

    I wonder if anyone reading this thread subscribes or periodically purchases the printed edtion of Barron's.

    If anyone has the issue for 8/13/07, in the Departments section there is another section named Market Watch. If my memory is correct in this editon there was a comment posted from -Tom McClellan, the son of the Tom McClellan who came up the McClellan Oscillator. I think the younger Mc. is a cycles-man.

    As I remember that piece in Barron's, which I saw online, McClellan's cycle analysis may have called the July top or the "bottom" up to his point of publication. He went on to say, as I recall, a bottom was in and there would be "speed bumps" for a new run up--the "bumps" occurring on 8/22-23 and on 8/30. Heavens, I don't know how much of that is actually a reflection of what he wrote.

    Is anyone willing to find that comment by McClellan and transcribe it into this thread? Were I not out in the boonies, I would go to my local library and get it myself.

    I don't normally pay much attention to short-term cycle predictions, but McClellan's comments struck me as being "on the money."
    Last edited by Jim Nickerson; August 26, 2007, 01:56 PM.

    Leave a comment:


  • Jim Nickerson
    replied
    Re: Bullish Information Re. Comment on Bowley's comment above.

    I have spotty data from CBOE put/call data for OEX and Equity, but I do have it from 12/30/99 to 3/17/00 (55 days). For that period of time the daily Equity put/call ratios averaged just 0.39, while the OEX put/call ratios averaged 1.33.

    Somewhere over the years, I have been indoctrinated to believe that the OEX is the "smart money" and the Equity is the "dumb money."

    My data support what Bowley said above about the degree of bullishness amongst those Equity put/call investors back near the markets' tops in 2000.

    Contrast the above with the following. For 7/19/07 and back 54 days, the average Equity put/call ratio was 0.59, which is much less bullishness accompanying the runup to the equity indices highs of 7/19/07 as compared to 2000.

    And the average ratio for the OEX put/call was 1.55 over the same 55 days mentioned immediately above.

    Since the three consective days of the Equity put/call ratios being above 1.0 (1.08, 1.05, 1.02 on 8/14, 15, 16 respectively) the SPX has gained 7.94% off its intraday low on 8/16, the DJI 7.41%, Nasdaq 7.96%, NDX 8.62%, and RUT 8.55%.

    So at least for a week, the high Equity put/call ratios above 1.0 nailed a very short-term bottom.
    Last edited by Jim Nickerson; September 01, 2007, 12:30 PM.

    Leave a comment:


  • Jim Nickerson
    replied
    Re: Bullish Information Re. Busllishness based on "Extreme Pessimism

    http://stockcharts.com/commentary/ar...20070825m.html

    Thomas Bowley at the bottom of 5 articles presented in link, put forth his arguments that "EXTREME PESSIMISM MARKS BOTTOM."

    Originally posted by Bowley
    We've discussed in the past the tendency of the market to put in long-term bottoms when the bearish sentiment reaches extreme levels. Extreme bearishness is exactly what we saw on Thursday, August 16. Over the past 4 years or so, we've experienced many occasions when the put call ratio has exceeded 1.0. But there have only been a dozen or so times that the "equity only" put call ratio has topped 1.0. Prior to the recent downtrend, when had seen only one previous occasion where that "equity only" put call ratio topped 1.0 on consecutive days. That occurred in mid-August 2004. On the chart below, you can clearly see that the extreme pessimism seen then marked a long-term bottom, one that was never
    retested.

    Many market pundits are suggesting that we're headed towards disaster given the recent credit crunch. Even that nasty "recession" word is being tossed about. We don't believe a word of it. We look at the current market conditions as a major buying opportunity. Our only question is whether the market can sustain its recent rally as we head into the worst calendar month of the year - September. Major market tops normally coincide with excess bullish sentiment. For instance in 2000 when the major indices began its downward spiral, it was routine to see put call ratios down around .40-.50 - very bullish indeed. Everyone was buying calls because it was "easy money." Margin debt used to buy stocks was at outrageous levels and when the selling began, it fed off itself - a domino effect if you will. We are looking at a market at the opposite end of the sentiment spectrum now. Instead of record margin debt to finance stocks, we see record short interest. Instead of bullish call buyers, we have bearish put buyers. The masses in the options world rarely get it right.

    When the Fed begins its interest rate cutting campaign - and the only argument in our minds is when, not if - the stock market will snap back like a stretched rubber band. We've only seen the beginning in the last week. We maintain our very bullish stance on the market with a bias towards the large cap NASDAQ 100 index.
    I don't know anything about Bowley.

    Back on 8/17/07, I made a similar comment about the Equity Put/Call ratio being above 1.0 for three days running post #143 above.

    Leave a comment:

Working...
X