Announcement

Collapse
No announcement yet.

Does USA 2009 = Argentina 2001? Part I: Falling economy reaches terminal velocity - Eric Janszen

Collapse
X
 
  • Filter
  • Time
  • Show
Clear All
new posts

  • Jim Nickerson
    replied
    Re: Does USA 2009 = Argentina 2001? Part I: Falling economy reaches terminal velocity - Eric Janszen

    Originally posted by bart View Post
    And I did note that above as well as touched on it in The Great Depression parallels... busted thread:


    ...


    Not only that, but using April 2008 is even further after the current stock market peak and current official recession start date (and in the other direction) that June 1929 is ahead of the actual start of the Great Depression.


    It still seems quite misleading to me, and significantly skews all the charts.

    How many have read that article and all the references and links to it on other sites, and don't realize that most of the charts are not aligned with either the start of the Great Depression or the current recession?
    It struck me that the Eichengreen and O'Rourke's point was to present their opinion of 1929 vs. recently based as they wrote, and as was quoted above, on "peaks in the world industrial production." I assume their data are correct, and that their graphs correctly reflect correct data.

    Whether or that presentation agrees with the reality of 1929 vs. now as you perceive it, Bart, or as you think it is best displayed is not an argument that I believe will be sorted out on these pages. They wrote what they wrote on the basis of their qualifications in presenting the graphs. Unless you can disprove the correctness of their data, the reasonable thing appears to be to take their study for what it shows as a valid comparison.
    Leave a comment:


  • bart
    replied
    Re: Does USA 2009 = Argentina 2001? Part I: Falling economy reaches terminal velocity - Eric Janszen

    Originally posted by Jim Nickerson View Post
    Here's what Eicengreen and O'Rourke stated with regard to the presentation of the data in their graphs.

    Comparing the Great Depression to now for the world, not just the US

    • This and most other commentary contrasting the two episodes compares America then and now. This, however, is a misleading picture. The Great Depression was a global phenomenon. Even if it originated, in some sense, in the US, it was transmitted internationally by trade flows, capital flows and commodity prices. That said, different countries were affected differently. The US is not representative of their experiences.

    • Our Great Recession is every bit as global, earlier hopes for decoupling in Asia and Europe notwithstanding. Increasingly there is awareness that events have taken an even uglier turn outside the US, with even larger falls in manufacturing production, exports and equity prices.

    • In fact, when we look globally, as in Figure 1, the decline in industrial production in the last nine months has been at least as severe as in the nine months following the 1929 peak. (All graphs in this column track behaviour after the peaks in world industrial production, which occurred in June 1929 and April 2008.) Here, then, is a first illustration of how the global picture provides a very different and, indeed, more disturbing perspective than the US case considered by Krugman, which as noted earlier shows a smaller decline in manufacturing production now than then.

    http://www.voxeu.org/index.php?q=node/3421


    And I did note that above as well as touched on it in The Great Depression parallels... busted thread:
    Originally posted by bart
    The original article from which the misleading charts came was entitled "A Tale of Two Depressions", and one should expect that the charts would start when the Great Depression started or close to it - not 9-12 months off. Arbitrarily starting them when industrial production peaks is misleading at best, even excluding how much of global GDP is service based.
    ...

    Originally posted by bart
    Here are the starting quarter dates of the Great Depression in various countries (source: Romer) sorted by start dates and as you can see, they're mostly nowhere around the June 1929 date at which that stock chart starts.


    Germany 1928,1
    Brazil 1928,3
    Poland 1929,1
    Canada 1929,2
    Argentina 1929,2
    United States 1929,3
    Italy 1929,3
    Belgium 1929,3
    Switzerland 1929,4
    Czechoslovakia 1929,4
    Netherlands 1929,4
    India 1929,4
    Great Britain 1930,1
    Japan 1930,1
    South Africa 1930,1
    France 1930,2
    Sweden 1930,2
    Denmark 1930,4
    Not only that, but using April 2008 is even further after the current stock market peak and current official recession start date (and in the other direction) that June 1929 is ahead of the actual start of the Great Depression.


    It still seems quite misleading to me, and significantly skews all the charts.

    How many have read that article and all the references and links to it on other sites, and don't realize that most of the charts are not aligned with either the start of the Great Depression or the current recession?
    Last edited by bart; June 27, 2009, 12:14 AM.

    Leave a comment:


  • Jim Nickerson
    replied
    Re: Does USA 2009 = Argentina 2001? Part I: Falling economy reaches terminal velocity - Eric Janszen

    Here's what Eicengreen and O'Rourke stated with regard to the presentation of the data in their graphs.

    Comparing the Great Depression to now for the world, not just the US

    • This and most other commentary contrasting the two episodes compares America then and now. This, however, is a misleading picture. The Great Depression was a global phenomenon. Even if it originated, in some sense, in the US, it was transmitted internationally by trade flows, capital flows and commodity prices. That said, different countries were affected differently. The US is not representative of their experiences.
    • Our Great Recession is every bit as global, earlier hopes for decoupling in Asia and Europe notwithstanding. Increasingly there is awareness that events have taken an even uglier turn outside the US, with even larger falls in manufacturing production, exports and equity prices.
    • In fact, when we look globally, as in Figure 1, the decline in industrial production in the last nine months has been at least as severe as in the nine months following the 1929 peak. (All graphs in this column track behaviour after the peaks in world industrial production, which occurred in June 1929 and April 2008.) Here, then, is a first illustration of how the global picture provides a very different and, indeed, more disturbing perspective than the US case considered by Krugman, which as noted earlier shows a smaller decline in manufacturing production now than then.
    http://www.voxeu.org/index.php?q=node/3421

    Leave a comment:


  • bart
    replied
    Re: Does USA 2009 = Argentina 2001? Part I: Falling economy reaches terminal velocity - Eric Janszen

    Originally posted by FRED View Post
    All well and fine to assert one is right and the other is wrong, but what evidence do you have to help us decide?
    Go to the source central bank sites, download the broad money stats, convert them to dollars using then current exchange rates and do a chart. Do a similar exercise with all the stock indexes.

    The primary issue though is one of timing or start dates. They started their money stats in 1925 & 2004. The Great Depression started in 3Q 1929 (or later - see Romer for start dates in different countries), which is at least 4.75 years after 1925. Adding that to 2004 gets us to a start of 3Q 2008, which is almost a full year after the markets peaked.

    The original article from which the misleading charts came was entitled "A Tale of Two Depressions", and one should expect that the charts would start when the Great Depression started or close to it - not 9-12 months off. Arbitrarily starting them when industrial production peaks is misleading at best, even excluding how much of global GDP is service based.

    The same issue applies to stocks, although the date difference is smaller at 3-9 months.
    Additionally, their stock chart doesn't name the current day world stock index that they're using... and I'm unaware of any major one or even an average that shows performance as bad as their current day chart shows.
    Last edited by bart; June 27, 2009, 12:03 AM.

    Leave a comment:


  • FRED
    replied
    Re: Does USA 2009 = Argentina 2001? Part I: Falling economy reaches terminal velocity - Eric Janszen

    Originally posted by bart View Post
    Here's the one on global money supply, which again is just plain wrong or misleading.


    The one I just built:


    The misleading or incorrect one:


    I urge extreme caution for anyone trying to draw conclusions from those misleading or outright wrong charts.
    All well and fine to assert one is right and the other is wrong, but what evidence do you have to help us decide?

    Leave a comment:


  • bart
    replied
    Re: Does USA 2009 = Argentina 2001? Part I: Falling economy reaches terminal velocity - Eric Janszen

    duplicated
    Last edited by bart; June 26, 2009, 11:43 PM. Reason: duplicated

    Leave a comment:


  • bart
    replied
    Re: Does USA 2009 = Argentina 2001? Part I: Falling economy reaches terminal velocity - Eric Janszen

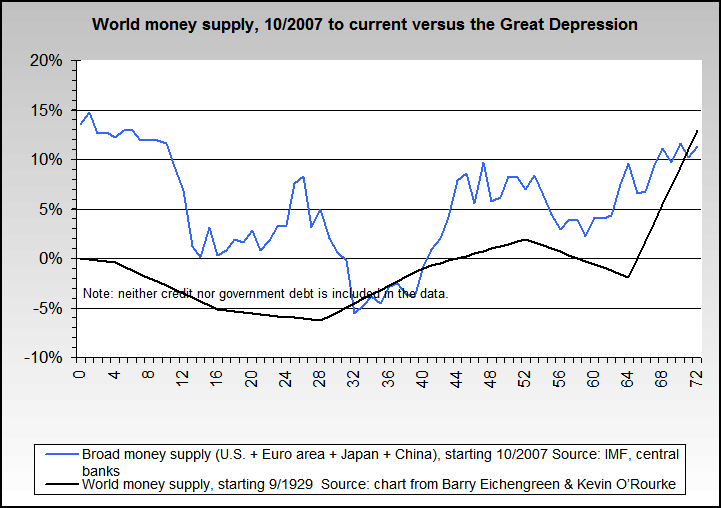
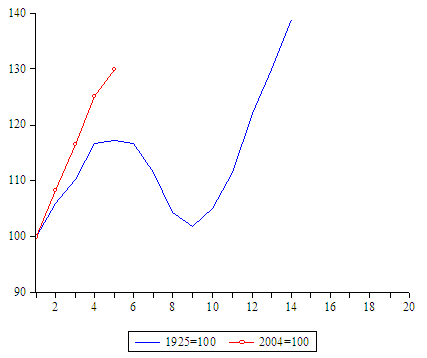
    Here's the one on global money supply, which again is just plain wrong or misleading.


    The one I just built:


    The misleading or incorrect one:


    I urge extreme caution for anyone trying to draw conclusions from those misleading or outright wrong charts.

    Leave a comment:


  • FRED
    replied
    Re: Does USA 2009 = Argentina 2001? Part I: Falling economy reaches terminal velocity - Eric Janszen

    Originally posted by magicvent View Post
    If you expect long term rates to be 7% next year, why not just short them?
    Can you spot the UST short seller in this picture?


    Leave a comment:


  • FRED
    replied
    Re: Does USA 2009 = Argentina 2001? Part I: Falling economy reaches terminal velocity - Eric Janszen

    Thank you, bart. That's what we call iTulip factual rigor!

    Leave a comment:


  • bart
    replied
    Re: Does USA 2009 = Argentina 2001? Part I: Falling economy reaches terminal velocity - Eric Janszen

    Great article as usual EJ, and I'm in general agreement... except for the portions based on two of the non iTulip charts - the world stock markets and the world money supply.


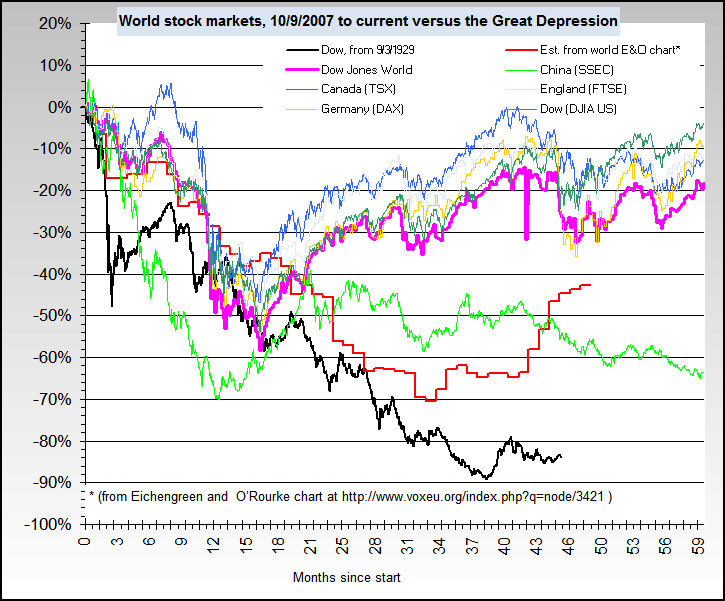
    I just spent quite a while to build another one for the stock market comparison, and even visually estimated the data from the non iTulip one... and its just plain wrong!


    Here are the starting quarter dates of the Great Depression in various countries (source: Romer) sorted by start dates and as you can see, they're mostly nowhere around the June 1929 date at which that stock chart starts.


    Germany 1928,1
    Brazil 1928,3
    Poland 1929,1
    Canada 1929,2
    Argentina 1929,2
    United States 1929,3
    Italy 1929,3
    Belgium 1929,3
    Switzerland 1929,4
    Czechoslovakia 1929,4
    Netherlands 1929,4
    India 1929,4
    Great Britain 1930,1
    Japan 1930,1
    South Africa 1930,1
    France 1930,2
    Sweden 1930,2
    Denmark 1930,4


    Using the basic idea that the original article from which those charts came was about the GD, I brought the data visually forward 3-4 months to match up with Sept 1929 and also used the most recent closing prices of many world stock markets.
    In other words, both charts are based on stock market peaks... and I could also make a case that September 1929 is too early for the start of the *world* Great Depression, which would make the comparison between then & now look even better.


    The black is of course the Dow from 9/1929 on, the red is from the chart with an incorrect starting date and the hot pink is the Dow Jones World Index... and its also a spaghetti chart since someone will inevitably ask "What about the ____ stock market?".
    And the extra stock markets show that the Dow Jones World Index is a reasonable compromise for most key world markets.


    But the bottom line is in all three extra dark lines... and shows that world stock markets are NOT currently worse than the comparable period of the Great Depression.


    Here's my new chart:


    Here's the one I consider to be incorrect and misleading.


    I'll be working on a similar comparison chart for global money supply soon, but I expect similar results.
    Last edited by bart; June 26, 2009, 09:16 PM.

    Leave a comment:


  • magicvent
    replied
    Re: Does USA 2009 = Argentina 2001? Part I: Falling economy reaches terminal velocity - Eric Janszen

    If you expect long term rates to be 7% next year, why not just short them?

    Leave a comment:


  • Ghent12
    replied
    Re: Does USA 2009 = Argentina 2001? Part I: Falling economy reaches terminal velocity - Eric Janszen

    Originally posted by ASH View Post
    It's either nitpicking the editing, or nothing, on this post. Stuff like that jumps out at some folks who have the misfortune to be sensitized to it, distracting from the important content. Presentation does matter a little -- it's why we tend to communicate on these fora in complete sentences rather than texting shortscript.
    so i was like OMG im scared str8 when i red this!!!

    Yes, the small imperfections did jump out to me too and served as a distraction. I made a concerted effort to go over the sentence again and full absorb what I could from it anyways

    So I increased my PM portfolio by 450% today...

    Leave a comment:


  • metalman
    replied
    Re: Does USA 2009 = Argentina 2001? Part I: Falling economy reaches terminal velocity - Eric Janszen

    Originally posted by sn1p3r View Post
    I thought the Argentinian Ka-Poom theory was about Gov Sanford's whereabouts :p
    off metalman goes to argentina to visit the gal he met on the internets... he hears the women are cute there...


    dang!!!

    let's see how long fred leaves this one up... :cool:
    Last edited by FRED; June 26, 2009, 08:41 PM. Reason: Not iTulip material.

    Leave a comment:


  • Guest's Avatar
    Guest replied
    Re: Does USA 2009 = Argentina 2001? Part I: Falling economy reaches terminal velocity - Eric Janszen

    I thought the Argentinian Ka-Poom theory was about Gov Sanford's whereabouts :p

    Leave a comment:


  • jpatter666
    replied
    Re: Does USA 2009 = Argentina 2001? Part I: Falling economy reaches terminal velocity - Eric Janszen

    Originally posted by ASH View Post
    It's either nitpicking the editing, or nothing, on this post. Stuff like that jumps out at some folks who have the misfortune to be sensitized to it, distracting from the important content. Presentation does matter a little -- it's why we tend to communicate on these fora in complete sentences rather than texting shortscript.

    As for the content -- everything made sense, and Part II was particularly valuable by outlining concrete metrics from which to derive a "POOM" warning indicator. These posts were the most useful in months.
    Agreed. To shamelessly steal Gardner's Bible quip:

    Reading iTulip straight through is at least 70 percent discipline, like learning Latin. But the good parts are, of course, simply amazing. EJ is an extremely uneven writer, but when he's good, nobody can touch him.

    Now -- after I drain a bottle of Maalox, I'll start contemplating how to react to this.

    Leave a comment:

Working...
X