Announcement

Collapse
No announcement yet.

Does USA 2009 = Argentina 2001? Part I: Falling economy reaches terminal velocity - Eric Janszen

Collapse
X
 
  • Filter
  • Time
  • Show
Clear All
new posts

  • Jay
    replied
    Re: Does USA 2009 = Argentina 2001? Part I: Falling economy reaches terminal velocity - Eric Janszen

    Originally posted by bart View Post
    In the Argentina case in that chart, velocity took off well after the corralito (you couldn't send money out of the country - it was "corraled") was imposed and the peso lost over 3/4 of its value. The main point of the chart is to show that it did take off at the time.

    Effectively, events in December 2001 were very obvious to anyone who was paying attention. In other words, the chart lagged the actual "currency event". Velocity itself, especially as represented in my charts, is a fluid concept since it has more than one definition. The various velocity charts only show one of the definitions - the central bank and government response.

    At the beginning of a real "currency event", it's quite obvious. Its caused by things like a government announcement, a political event, an "unexpected" war, an assassination or some other similar shock. In the US, I strongly suspect that there will be little warning and probably very little time to respond effectively.
    In my opinion, the simplest thing to do is look at is the gold price itself - if it takes off without any obvious reason, its likely telling the story that a few insiders know what's coming. Anyone without substantial hard assets at this time in my opinion is taking a gigantic risk with their future.
    It would make sense that in a typical "currency event" velocity takes off after the inciting event , i.e. once the populace, who are behind the insiders time wise, realize there is a problem they start spending like mad to get what they can when they can. But the big wigs are out in front of the initial event getting their moolah out of dodge first. So it makes sense to me that velocity would lag the inciting event. Is that also typical in other cases? If that is so, as you have said, watch the gold price and don't be caught short handed. Did Argentina invoke any restrictive PM laws at the time? Thanks Bart.

    Poverty in Argentina
    Date of
    measurement
    Extreme
    poverty
    Under
    poverty
    line
    May 2001 11.6% 35.9%
    Oct 2001 13.6% 38.3%
    May 2002 24.8% 53.0%
    Oct 2002 27.5% 57.5%
    May 2003 26.3% 54.7%
    2nd sem 2003 20.5% 47.8%
    1st sem 2004 17.0% 44.3%
    2nd sem 2004 15.0% 40.2%
    1st sem 2005 13.6% 38.5%
    2nd sem 2005 12.2% 33.8%
    1st sem 2006 11.2% 31.4%
    2nd sem 2006 8.7% 26.4%
    2nd sem 2007 5.9% 20.6%
    1st sem 2008 5.1% 17.8%
    2nd sem 2008 4.4% 15.3%

    Leave a comment:


  • bart
    replied
    Re: Does USA 2009 = Argentina 2001? Part I: Falling economy reaches terminal velocity - Eric Janszen

    Originally posted by Jay View Post
    It sure will be interesting to see if the US is able to formally and unilaterally depreciate the dollar again in a world in which every country is fending off an economic meltdown and has no interest in seeing their own exports crash to save the US. How many military bases do we have again? ;)
    And there's no evil Soviet beast lurking this time...
    Indeed, and my Plaza Accord example was just one of a myriad of possibilities.

    I don't believe that the US will have any trouble devaluing the dollar - it has literally happened almost every week since 2002, with only a few exceptions (as Finster's FDI shows).

    And although there's no "Soviet beast" (love it ) this time, a short time looking around in tinfoil hat mode will show a lot more beasts available and waiting.


    Originally posted by Jay View Post
    As for Argentinian velocity, did it pick up just before inflation started, or just after? I guess another way to frame the question is whether another event (printing?) got the ball rolling and subsequently velocity took price level into the stratosphere or if a velocity shift was the inciting inflationary event. Difficult and possibly unanswerable, I know. When did they start printing in force?

    In the Argentina case in that chart, velocity took off well after the corralito (you couldn't send money out of the country - it was "corraled") was imposed and the peso lost over 3/4 of its value. The main point of the chart is to show that it did take off at the time.

    Effectively, events in December 2001 were very obvious to anyone who was paying attention. In other words, the chart lagged the actual "currency event". Velocity itself, especially as represented in my charts, is a fluid concept since it has more than one definition. The various velocity charts only show one of the definitions - the central bank and government response.

    At the beginning of a real "currency event", it's quite obvious. Its caused by things like a government announcement, a political event, an "unexpected" war, an assassination or some other similar shock. In the US, I strongly suspect that there will be little warning and probably very little time to respond effectively.
    In my opinion, the simplest thing to do is look at is the gold price itself - if it takes off without any obvious reason, its likely telling the story that a few insiders know what's coming. Anyone without substantial hard assets at this time in my opinion is taking a gigantic risk with their future.

    Leave a comment:


  • ThePythonicCow
    replied
    Re: Does USA 2009 = Argentina 2001? Part I: Falling economy reaches terminal velocity - Eric Janszen

    Originally posted by Jay View Post
    How many military bases do we have again? ;)
    Two years ago, according to a not necessarily reliable source quoting a not necessarily reliable source (The Worldwide Network of US Military Bases): "the US is thought to own a total of 737 bases in foreign lands."

    Leave a comment:


  • Jay
    replied
    Re: Does USA 2009 = Argentina 2001? Part I: Falling economy reaches terminal velocity - Eric Janszen

    Originally posted by bart View Post
    Tough question since its based so much on sentiment & opinion... but basically I don't think any currency these days has a "natural floor".

    No question that the world's major central banks have many more tricks up their sleeves - for all I know, we could see something like the Plaza Accord in 1985 in the future. I also don't think that things like the SDR will have less importance as the months & years go by and also think it likely that other currencies will be added to the SDR around the end of this year

    My basic take is that the major currencies take turns depreciating against each other, which masks that they're all losing purchasing power. It's misdirection in a way for one to be focused on the movements of one currency or currency group against another.
    It sure will be interesting to see if the US is able to formally and unilaterally depreciate the dollar again in a world in which every country is fending off an economic meltdown and has no interest in seeing their own exports crash to save the US. How many military bases do we have again? ;)
    And there's no evil Soviet beast lurking this time...

    As for Argentinian velocity, did it pick up just before inflation started, or just after? I guess another way to frame the question is whether another event (printing?) got the ball rolling and subsequently velocity took price level into the stratosphere or if a velocity shift was the inciting inflationary event. Difficult and possibly unanswerable, I know. When did they start printing in force?
    Last edited by Jay; July 02, 2009, 11:58 PM.

    Leave a comment:


  • bart
    replied
    Re: Does USA 2009 = Argentina 2001? Part I: Falling economy reaches terminal velocity - Eric Janszen

    Originally posted by Jay View Post
    This bears on a point that I have been ruminating over: even though the dollar is a piece of crap, since world trade and world financial transactions are primarily denominated in the dollar, which is now hard to come by (artificially?), does that mean it has a natural floor? At least until the various and sundry weaker powers of the world, who look to be constantly playing catchup, can wean the world off the greenback? It looks to me that the Fed and the Treasury might still have a few tricks up their sleeves.
    Tough question since its based so much on sentiment & opinion... but basically I don't think any currency these days has a "natural floor".

    No question that the world's major central banks have many more tricks up their sleeves - for all I know, we could see something like the Plaza Accord in 1985 in the future. I also don't think that things like the SDR will have less importance as the months & years go by and also think it likely that other currencies will be added to the SDR around the end of this year

    My basic take is that the major currencies take turns depreciating against each other, which masks that they're all losing purchasing power. It's misdirection in a way for one to be focused on the movements of one currency or currency group against another.


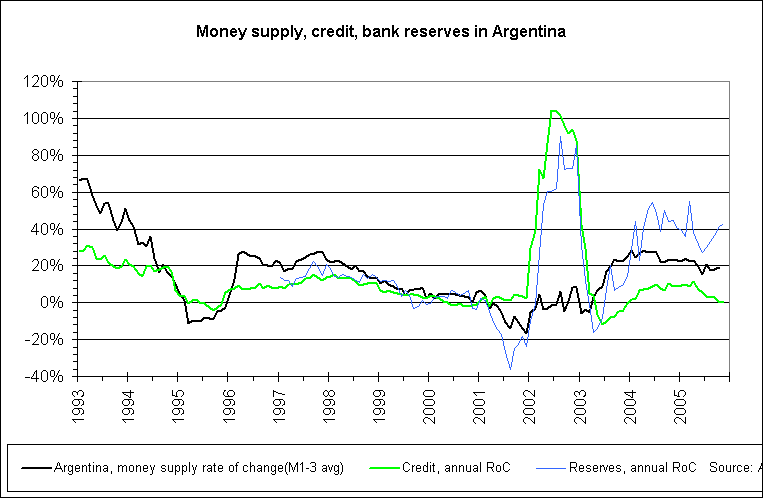
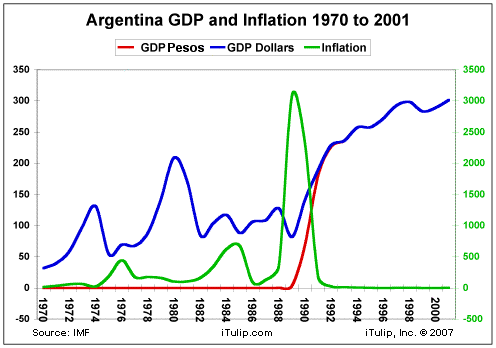
    And on the basic Argentina parallel, here's a general picture of velocity there from 1990-2005.

    Leave a comment:


  • FRED
    replied
    Re: Does USA 2009 = Argentina 2001? Part I: Falling economy reaches terminal velocity - Eric Janszen

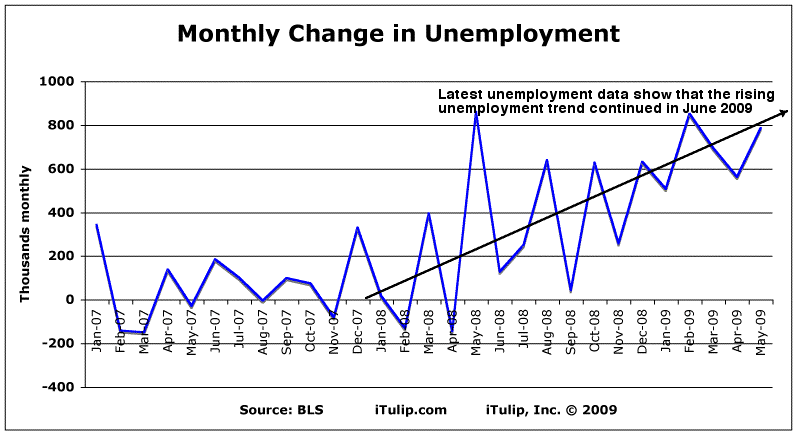
    In the Argentina vs USA article last we asked:


    Terminal Velocity of Unemployment: 6 million?

    Today we get our answer: No. Total unemployed since the start of the FIRE Economy Depression now stands at 7,300,000.


    The trend is still rising.


    Leave a comment:


  • Jay
    replied
    Re: Does USA 2009 = Argentina 2001? Part I: Falling economy reaches terminal velocity - Eric Janszen

    Originally posted by bart View Post
    Even more specifically, the world money supply in my current chart shows as having dropped *much* more now than during the comparable period in the 1930s. And the added note ("neither credit nor government debt is included in the data.") is intended as a warning that neither period include either credit or government debt, both of which are huge factors.
    This bears on a point that I have been ruminating over: even though the dollar is a piece of crap, since world trade and world financial transactions are primarily denominated in the dollar, which is now hard to come by (artificially?), does that mean it has a natural floor? At least until the various and sundry weaker powers of the world, who look to be constantly playing catchup, can wean the world off the greenback? It looks to me that the Fed and the Treasury might still have a few tricks up their sleeves.

    Leave a comment:


  • d_limiter
    replied
    Re: Does USA 2009 = Argentina 2001? Part I: Falling economy reaches terminal velocity - Eric Janszen

    Originally posted by bart View Post
    And *many* thanks to all that commented on my charts & work, it does help.
    I just want to add to the chorus - thanks for the additional explanation and charts. I feel I can just barely follow main points EJ makes, and so I really rely on commentary from you and others to help me understand the implications.

    Leave a comment:


  • FRED
    replied
    Re: Does USA 2009 = Argentina 2001? Part I: Falling economy reaches terminal velocity - Eric Janszen

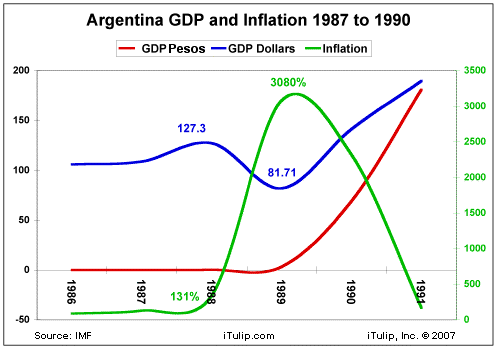
    Two additional charts from an analysis we did in 2007 on the first Argentine hyperinflation in the early 1990s:


    The peso was managed via a currency board starting in 1989
    following the hyperinflation as part of the stabilization program.
    Inflation fell from over 50% to near zero starting in 1985
    before climbing to the above 20% before rising in an
    out-of-control hyperinflation.


    Close up of the inflation event from 1988 to 1989

    Leave a comment:


  • bart
    replied
    Re: Does USA 2009 = Argentina 2001? Part I: Falling economy reaches terminal velocity - Eric Janszen

    This may help some.


    Leave a comment:


  • Wiley
    replied
    Re: Does USA 2009 = Argentina 2001? Part I: Falling economy reaches terminal velocity - Eric Janszen

    Is there data to support the "bubble" in Argentina's economy pre-crisis. What is the comparison to our bubble in consumption/debt, money expansion, etc?

    It would seem that our would be larger by orders of magnitude and what does that portend for the outcome if we follow their path?

    Leave a comment:


  • bart
    replied
    Re: Does USA 2009 = Argentina 2001? Part I: Falling economy reaches terminal velocity - Eric Janszen

    Originally posted by jtabeb View Post
    Bart, Thank you for the charts.

    I have to ask:

    you seem to be making a MAJOR implication as to what it would MEAN if the start of the derpression is misaligned.

    Could you please (for me, since I'm a simpleton) explicitly state what the implication is? It looks to be a big one, and I'm missing it, so I have to ask, because I want to CLEARLY UNDERSTAND what you are saying.

    Thank you.

    How about an analogy?
    A friend tells you something that he did in the past that's distasteful at best and you think it was 2 years ago, but it turns out later that it was 20 years ago. My point is that your opinion of him or her would be quite different after you found out that it was *actually* 20 years ago.

    It's also, more specifically, an issue of using a yardstick that you thought was one thing (the start of the Great Depression) but turned out to be something else (the peak of industrial production). The conclusions drawn would likely be quite different.

    Even more specifically, the world money supply in my current chart shows as having dropped *much* more now than during the comparable period in the 1930s. And the added note ("neither credit nor government debt is included in the data.") is intended as a warning that neither period include either credit or government debt, both of which are huge factors. In other words and as EJ's article covers quite well, take as many factors of the whole picture into account as possible.

    I also want to stress that its not so much that the other charts were wrong (and I likely over reacted since I handle so many emails, conversations and forum posts where folk have been inadvertently misled - and it does get to me sometimes) as it is that partial or incomplete or wrongly understood charts can be worse than none at all.

    Leave a comment:


  • bart
    replied
    Re: Does USA 2009 = Argentina 2001? Part I: Falling economy reaches terminal velocity - Eric Janszen

    Originally posted by FRED View Post
    Points taken on the start dates for the data. However, we stand by the point that we make with the global money markets and fiscal spending charts and want to make sure that readers don't miss that point in the data minutia.

    In the first year of this debt deflation crisis versus in 1930 governments are spending vastly more money more quickly to try to spend their way out of one kind of trouble, and in our opinion into another kind of trouble. In the final quarter of 2008 and first quarter of 2009 alone governments spent $2.2 trillion on fiscal stimulus as GDP fell. This level of deficit spending dwarfs any that occurred during The Great Depression.

    Very much agreed Fred (as my own comparison chart show in the new The Great Depression tight parallels... busted (v 2.0) thread), and sorry for diverting the thread into relative minutia.

    Hopefully the side points will move into that thread instead of confusing this one, which overall is one of iTulip's best in my opinion.

    Truly excellent work on Argentina, and my own data confirms the iTulip data/chart on China.


    Originally posted by FRED View Post
    Safe to say that is not going to happen--we'll get more stimulus spending before it does. :eek:

    As for the global money supply, again the philosophy and practice today are quite different than in the early 1930s. Compare interest rates in major countries in 1930 versus today and you'll see what I mean. That said, it's not strictly relevant to our point; what matters is not the global money supply but the difficulty that the U.S. is having expanding broad money, as your excellent M3 chart shows.
    There's virtually no doubt in my mind about more stimulus ahead, and not just in the US... like the $600 billion move by the ECB last week.

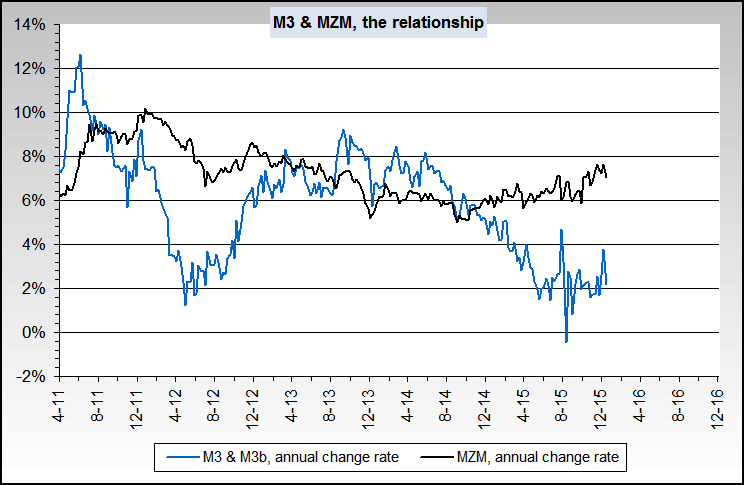
    Thanks for the atta-boy on my M3, and I also should remind you about MZM and that it tracks M3 reasonably well - or vice versa.


    Apologies again for the diversion, I went a bit over the top with my d posts due to concerns about misinterpretations on those depression charts.

    Leave a comment:


  • bart
    replied
    Re: Does USA 2009 = Argentina 2001? Part I: Falling economy reaches terminal velocity - Eric Janszen

    Originally posted by jk View Post
    i would also point out that the money supply charts are of different forms- yours a rate of change chart, theirs a chart of money supply size itself. you'd need to take the first derivative of their chart, then align the start dates to see if there's any difference at all. if so, that would mean that someone has wrong, or at least wrongly labeled data.
    From the data and understanding that I do have about world money supply history, I believe that their data is generally correct.

    But its misleading, partially because it starts in 1925 instead of 1929, partially because its yearly and partially because the data from current day is not current.

    As far as the chart style (change rate vs. a level), my chart could be off a bit since I visually estimated their data points, but if you look at my actual line shape and extend the scale in your mind I think you'll see that it comes quite close to matching theirs.

    I also chose to go with change rates since that's my convention, and I also already had the current data in that format.

    Leave a comment:


  • bart
    replied
    Re: Does USA 2009 = Argentina 2001? Part I: Falling economy reaches terminal velocity - Eric Janszen

    Originally posted by metalman View Post
    ok if i send your version to Barry Eichengreen & Kevin H. O’Rourke? i'd like to hear what they say.
    Send them here if you like:
    The Great Depression tight parallels... busted (v 2.0)
    It's still a work in progress but there's changes to my original article and a new chart, as well as commentary on their article and charts.

    I still maintain that its quite misleading, especially for the average person.

    I've seen multiple conclusions on the 'net like "It’s a Depression alright" which in my opinion can be quite a dangerous conclusion to make especially given things like the US industrial production index having dropped 53% during the Great Depression... and 48% in the mid 1970s recession.


    And *many* thanks to all that commented on my charts & work, it does help.

    It can get quite frustrating at times to try and cleanly and clearly get a point or points across, especially when I see how things are misinterpreted (*cough, cough*) on various blogs via incoming emails to me, etc.

    Leave a comment:

Working...
X