
Originally posted by ASH
View Post
-
Re: Real DOW Update: Still looking for a bottom?
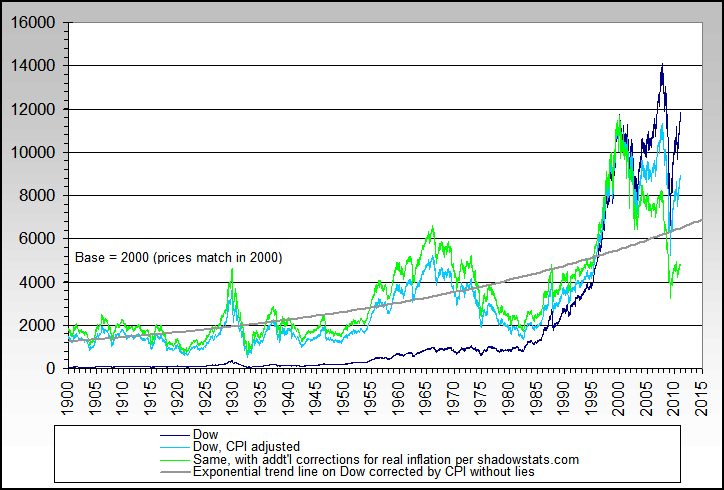
bart: You did a linear fit rather than an exponential, and included the entire data set -- right?Originally posted by LargoWinch View Post
My impression is that iTulip fit a "compounding rate of growth" model rather than a straight line, and they are not including data from recent decades.Leave a comment:
-
Re: Real DOW Update: Still looking for a bottom?
bart, am I correct to assume that your chart implies that the Dow is below its trend line in real (shadowstats) terms?
If so, that appears to be a divergence from iTulip real Dow chart no?
Or perhaps your trend line differs from iTulip's trend line, hence a direct comparison is not possible...?Leave a comment:
-
Re: Real DOW Update: Still looking for a bottom?
Real estate and land would do well under hyperinflation. Under high inflation, it would depend.
When has the stock market been an accurate predictor of the economy? It is governed by manics/depressives who bid up and short the stocks with the slightest of whims. In periods of high inflation the stock market may continue to fall but commodities will improve. Under hyperinflation, many businesses will go bust while others will succeed. The indexes will rise as it drops the dead weight and adds those that are rising. However, to assume that all stocks will rise is not correct.
Lukester please stop with your gloating over the recent drop in gold prices, it is very unbecoming and annoying. First your predictions of 1-2 year decline has not fully played out yet so it may be premature to wave the victory flag. Second, no one is perfect. Learn from your mistake and be humble with your successes. Many of your predictions have not panned out let alone been coherent.
Final thought, the gold market reeks of current manipulation. They have been successful in suppressing daily gold prices.Leave a comment:
-
Re: Real DOW Update: Still looking for a bottom?
Why not? Wouldn't leverage disappear in hyperinflation? In real terms hyperinflation would make things worse not better. I would expect real estate values to fall as well in hyperinflation. If hyperinflation occurs I doubt there will be too many places willing to lend a 30 year mortgage.Leave a comment:
-
 Guest repliedRe: Real DOW Update: Still looking for a bottom?
You can't have very high inflation, let alone hyperinflation and a collapsing stock market. One of these two variables is either lying (evidently it's not the stock market lying, as it's doing a swan dive) or that variable will have to turn right around and scoot right back towards the other one in a hurry - it's either that, or we are in an environment which has nothing whatsoever to do with inflation. My suggestion, DOW has to turn and scoot up in a hurry just as soon as iTulip's core thesis (very high inflation) manifests. Last time I checked, iTulip's thesis was that inflation would have to appear ... soon. IMO proponents of the DOW as a bottomless pit are not adding this up. Or iTulip's high inflation forecast is way early. Take your pick. You can't have both.Leave a comment:
-
Re: Real DOW Update: Still looking for a bottom?
The Real Dow seems to require some interpretation depending on what you want to predict. For example, if it were to fall like a rock (which today seems rather likely) then it would hit the line at maybe 4500, but that would correspond to an actual DJI price of maybe 5500 or so. Then inflation might buoy up the prices (but not the Real Dow) after an undershoot dip below the line. We are not all that far from the projected value.
So, you have to think a lot about interpreting the results. The bleak look of the values is because they are already inflation adjusted, something that most investors do not consider all that well. In fact, if they considered inflation they might not generally be investors. However, there are some other possible interpretations. If, after a flirtation with the 4000s in Real Dow, the prices start to track the curve, then that says that the raw DJI prices would be keeping just a bit ahead of inflation whatever the rate was. That prediction would imply that acquiring stocks in the dip below the line might be a good hedge vs moderate, not hyper inflation, especially if you have some gold already.
Are my interpretations right? Are they even reasonable? Can somebody offer a clearer explanation and maybe a family of predictions?Leave a comment:
-
Re: Real DOW Update: Still looking for a bottom?
Pre-SHTF business opportunity?Originally posted by RickBishop View Post
Leave a comment:
-
Re: Real DOW Update: Still looking for a bottom?
It looks to me like they chose a cutoff date (say 1995?), after which the stock market behavior was deemed to be "aberrant", and then did a fit to the data before the cutoff date. Perhaps the thought was to find the average rate of real asset price growth, absent asset price inflation related to the FIRE economy. One might then think we'd see a return to the non-FIRE price levels, after the FIRE economy implodes. Of course, by choosing to discard "aberrant" data when making a fit, one guarantees that said data then looks aberrant when compared to the fit.Originally posted by sn1p3r View Post
My impression is that this analysis has value as a "big picture" look at the stock market, but -- similar to plots of the DJIA-to-gold ratio -- has little quantitative accuracy. In other words, it was a great way to see that stocks were overpriced when they were outrageously overpriced, but probably can't be relied upon to find a quantitative bottom in the market.Leave a comment:
-
Re: Real DOW Update: Still looking for a bottom?
Zoog,
Thanks for the reply. I have done some searching and found this paper from Georgia Tech (http://mgt.gatech.edu/fac_research/centers_initiatives/finlab/finlab_files/ga_tech_dow_gdp_2007.pdf)
I can't figure out how to extract graph of nominal GDP vs Dow from 1916 to 2006 but you should look. Essentially they track each other except;
1) 1920 to 1940, when Dow peaks way above GDP especially in 1929
2) 1969 to 2000 the Dow falls below GDP line and does not catch up until 2000 or 2001
Here is an excerpt from paper describing this;
One year of departure was 1929, when the Dow industrials averaged 311.2, exceeding
GDP of 103.9($Billions) by nearly 200%. By 1932, this discrepancy had been all but erased,
with the Dow industrials averaging 64.6 as compared with GDP for the year of 58.5($B). After
another brief departure in the late 1930s, the Dow industrials correlated closely with GDP
through the late 1960s. Even in the bull market year of 1966, the Dow industrials averaged
873.6 in a year in which GDP came in very closely at 787.8($B). In 1968, the two measures
were almost identical. After 1968, the Dow industrials and GDP parted company again. GDP
moved upward as the U.S. economy continued to grow, at least in nominal terms. However, the
Dow industrials lagged, as the market doldrums of the late 1960s, 1970s and early 1980s gained
a stronghold. The disparity between the two grew as oil shocks, inflation, and high interest rates
took their toll on share prices. In 1982 the Dow industrials averaged 73% below GDP. That
year, 1982, was the first year of the super-bull market that ran into 2000.
In this light, the bull market of the 1980s and 1990s can be seen as having been a case of
catch-up, where the Dow worked its way back toward GDP after having been left behind
sometime in the late 1960s. For example, as recently as 1994, the Dow industrials averaged
more than 46% below GDP. However, by 1998, as the bull market accelerated, the difference
between the two was eliminated.
In 1999 and 2000, the Dow industrials exceeded nominal GDP. During 2001, however,
with declines in the Dow and increases in nominal GDP, the two measures were once again,
nearly identical. Continued weakness in stock prices during 2002 resulted in the Dow averaging
about twelve percent less than nominal GDP. Then, beginning in early 2003, with the Dow
average trading below 8,000, the most recent bull market began, moving the Dow to close the
gap with nominal GDP. The Dow�s recent peak above 14,000 was slightly higher than nominal
GDP of 13,700($B), annualized through the second quarter of 2007.Leave a comment:
-
Re: Real DOW Update: Still looking for a bottom?
You might be interested in reading a recent article by John Mauldin. He basically debunks the notion of buy and hold. Most people would consider a twenty year time frame to be "long term", but he stratifies 20 year segments showing that some are winners and some losers.Originally posted by aa View PostLeave a comment:
-
Guest repliedRe: Real DOW Update: Still looking for a bottom?
So where does the 1.64% yield curve number come from? Is this backed into based on a historic controlled growth?Leave a comment:
-
Re: Real DOW Update: Still looking for a bottom?
If I buy not only into "Ka" but also into "Poom" (which I do) then I would also buy into this curve banking sharply upward after it bottoms.
Eric... to imply that this curve will continue into the future as shown (with moderate inflation), seems to contradict (or at least ignore) the "Poom" /inflationary portion of your own theory. Let's estimate the bailouts that have been and will be made, and include the "Poom" inflationary effects to paint this graph properly and fully reflect the amazing vision you've given to us all. What happens after it bottoms?Leave a comment:


Leave a comment: