Re: Case-Shiller Housing Charts - Long-term, etc.
a bubble causes people to spend more than they earn. how to create demand in a capitalist world that does its best to constrain it 101.
-
Re: Case-Shiller Housing Charts - Long-term, etc.
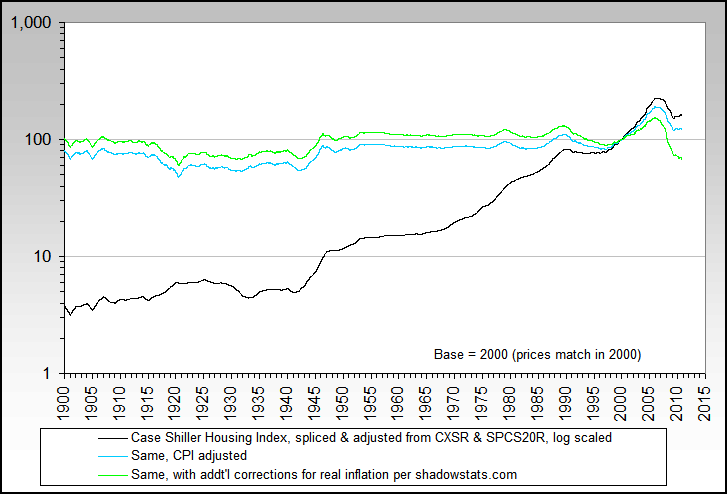
Same chart, log based:
Leave a comment:
-
Re: Case-Shiller Housing Charts - Long-term, etc.
Here's an updated (and smaller ) version of the Credit Suisse chart

Leave a comment:
-
Re: Case-Shiller Housing Charts - Long-term, etc.

This has been a fundamental chart since it came out. The NAR is helpless when confronted with this graphic. (Sorry it's so damn big- can they be reduced?)Leave a comment:
-
Re: Case-Shiller Housing Charts - Long-term, etc.
March / Q1 2010 Case-Shiller update


Leave a comment:
-
Re: Case-Shiller Housing Charts - Long-term, etc.
S&P today released the December 2009 Case-Shiller data.
After rising for two quarters, the national index ticked down in Q4 2009, registering a decline of 28.35% from the peak.


Most cities have recovered somewhat from their furthest declines, however Charlotte, Seattle, and Tampa registered their maximum declines thus far; Las Vegas only gained 0.07% from the previous month.

Las Vegas has nearly lost all the gains since January 2000. Detroit of course has fallen well below that point. Cleveland, which only had a modest run-up anyway, is also approaching values of a decade ago.


Low-end homes in Las Vegas and Phoenix have wiped out all gains from January 2000. In most of the included cities, low-end homes rose the most during the housing boom, fueled by easy credit and (in my opinion) gentrification profit fantasies (see pages 91-93 of Stuff White People Like - the book includes an amusing timeline). After the juice was taken away, people came to their senses and realized crummy houses in run-down neighborhoods are likely to stay that way.

My guess, and it is only a guess, is that housing prices will be rangebound until the next recession, fluctuating in the usual seasonal patterns. The home buyers credit that originally was to end in November 2009 has been extended to April 2010. It will likely be extended ad infinitum, but with diminishing influence on home prices. The well-known Credit Suisse chart (the most recent one I have is from almost a year ago) shows a steady increase in mortgage resets and recasts over the next two years. Any foreclosures and short sales resulting from that are likely to hit the market in 2011-2012.

Leave a comment:
-
Re: Case-Shiller Housing Charts - Long-term, etc.
National charts updated through Q3 2009, city charts through September 2009.
A second quarter of recovery has brought the national nominal Case-Shiller index back up to a 27.77% drop from the peak in Q2 2006.


I ghosted in the maximum drop chart for comparison.

Leave a comment:
-
Re: Case-Shiller Housing Charts - Long-term, etc.
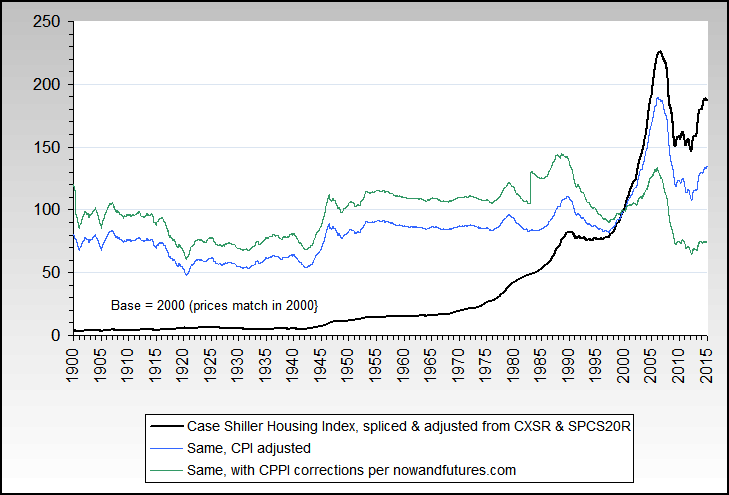
Using this chart a case can be made that if house prices stabilize around here, and cpi continues up the reversion to the norm will be complete.Leave a comment:
-
Re: Case-Shiller Housing Charts - Long-term, etc.
National charts updated through Q2 2009, city charts through June 2009.
The national nominal Case-Shiller index has recovered somewhat to a 30.16% drop from the peak. This is the first quarter the index has risen since the peak in Q2 2006.


Of the 20 cities tracked by Case-Shiller, all but Detroit and Las Vegas have pulled back from their maximum lows since peaking, thus no surprise that the national number has also gained. A number of cities are barely above their lows, however.


I don't have a chart of current tiered values but they have all pulled back some from the maximum drops. The low end still has the largest percentage declines, except for Portland.

Leave a comment:
-
Re: Case-Shiller Housing Charts - Long-term, etc.
National charts updated through Q1 2009, city charts through March 2009.
The national nominal Case-Shiller index has dropped 32.18% from the peak in Q2 2006.

The CPI-adjusted index has dropped 36.26% from the peak in Q4 2005.

Detroit continues to drop below where they were in January 2000, with Cleveland also below, and Atlanta and Phoenix approaching zero.

Phoenix leads the decline with a 53.03% drop since peaking in June 2006.

The low-end market continues to drop the most, except in Portland where the high-end has declined a little more.
For some reason Case-Shiller has had problems with their tiered data for Cleveland, so I have removed that city from the following chart.

Leave a comment:
-
Re: Case-Shiller Housing Charts - Long-term, etc.
So if prices adjust back to their historic levels with respect to the CPI, it looks like we have another 40% to go in constant dollars. If prices over-correct, it could be 50% or more. And if the pace matches the decline over the last few years, the bottom might hit in another two years or so -- faster than Japan's RE bubble collapsed, but the whole crisis has progressed faster than theirs.
Sounds about right to me.Leave a comment:
-
Re: Case-Shiller Housing Charts - Long-term, etc.
The connection is not immediately obvious, but these are the Charts of the Century.

Leave a comment:
-
Re: Case-Shiller Housing Charts - Long-term, etc.
The first chart has to be the chart of the century.Leave a comment:
-
Re: Case-Shiller Housing Charts - Long-term, etc.
I was lucky enough to have sold a house in Las Vegas Jan 06 for 430k having dropped the price twice over a 9 month period from 465k. I check that house on zillow.com today and it shows 314k. I noticed by summer 05 things in Vegas were changing rapidly to the downside but there were still fish rushing to get into the market. Currently a very happy renter.Leave a comment:


Leave a comment: