Originally posted by bart
View Post
-
Re: Case-Shiller Housing Charts - Long-term, etc.
Thank you Bart - appreciate your thoughts. -
Re: Case-Shiller Housing Charts - Long-term, etc.
I'm certainly not wedded to a Q1 2012 potential bottom, just throwing out thoughts or possibilities. Negative info certainly does abound, and political situations and idiots are legion.
I think there is a housing index that is based on square feet - sorry, don't recall the name.Leave a comment:
-
Re: Case-Shiller Housing Charts - Long-term, etc.
Aren't prices always higher in the summer than the spring? What were the stats last summer?
It seems to me people with bigger, more expensive houses will wait until summer to sell. They have kids. People with smaller, cheaper houses probably have less children on average and do not care about the school year. They can sell their house at any time.
And, let's not forget all the foreclosures. The banks have already foreclosed on and sold most of the cheap houses. It is the more expensive houses that have not been fully marked down yet. A foreclosed mansion will certainly drive that price stat up, for example.
I'd like see a price per square foot graph or something to reduce the noise.
I also recall from somewhere on iTulip that we were to expect this. There would come a time when real estate seemed like a good deal again. People would buy (investors) and then there would be the final flush to really screw everybody over. Only after the final collapse will the real deals be available.
I am itching to buy a house, but in my opinion they are still way over-priced. I may end up taking out one of those free money mortgages next spring and making the plunge regardless. Hopefully, the next recession is in full force then and people will sell cheap.Leave a comment:
-
Re: Case-Shiller Housing Charts - Long-term, etc.
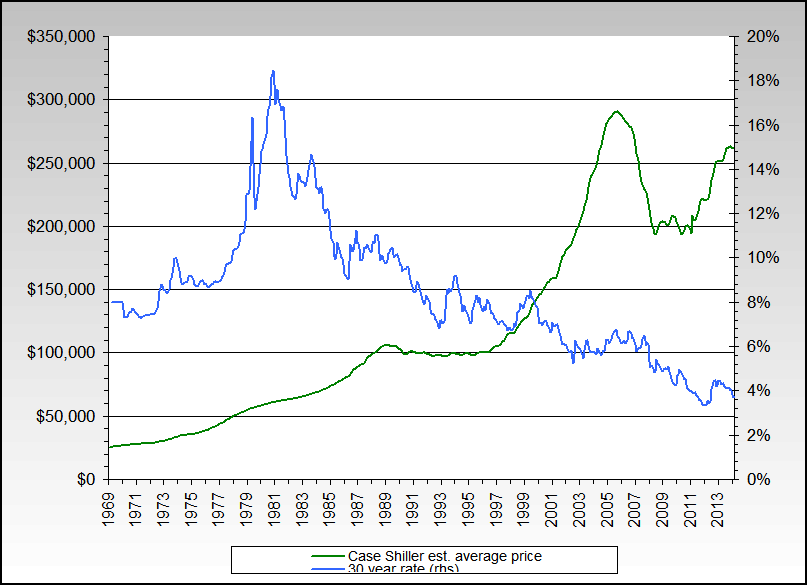
For what its worth on rates:
Leave a comment:
-
Re: Case-Shiller Housing Charts - Long-term, etc.
Fair enough.Originally posted by bart
I wanted to ask for clarification because I've seen studies which equate a 6% increase in interest rates with a 30% drop in house prices.
I think we can all agree that we'll see at least that much interest rate increase at some POOM point in the future, though the timing is debatable.
However, if said POOM interest rate jump is say in 2013 or even 2014, the implication is that the 30% or more drop in housing prices due to interest rate effects will be offset by over 9% annualized inflation (2014) or 14% annualized inflation (2013).
This is eminently possible; I'm just looking for ways to confirm if this outcome is what is to come.Leave a comment:
-
Re: Case-Shiller Housing Charts - Long-term, etc.
Total unemployment is already around 23% and sure could go higher - and that still means over 3/4 are working while the CS housing index is "only" down 4% annually, total money supply is still growing, hourly earnings are still growing nominally, the Fed is on the job with relative interest rate control, sentiment is quite negative on housing, see step 8 & 9 above, I'm allowing for another 5-10% drop, etc.Originally posted by WDCRob View Post
Rampant sure may happen, but we have 8%+ right now - way higher than what we had in the last hard asset cycle from 1966-1980... and nominal national house prices basically never went down during that period.Leave a comment:
-
Re: Case-Shiller Housing Charts - Long-term, etc.
First, I'm not looking at a possible bottom now, I'm looking at Q1 2012 - and again, it's very much tentative. I'm also looking at another relative low (like the recent one) in rates in early 2012.Originally posted by c1ue View Post
And yes, underlying inflation is also part of what I'm looking at as well as things like the increasing foreign investment trends and possible more government "support" etc.Leave a comment:
-
Re: Case-Shiller Housing Charts - Long-term, etc.
Bart you've really given me something to chew on here. I'm struggling to see how another round of growing unemployment, falling wages and higher interest rates wouldn't result in another (potentially big) down wave in RE.
I think you're suggesting that rampant inflation will make future declines real instead of nominal, but how is inflation going to pass through to housing in the scenario above?Leave a comment:
-
Re: Case-Shiller Housing Charts - Long-term, etc.
I am wondering - why do you see a bottom happening now even though interest rates will not rise for another 18 months or more?Originally posted by bart
Or is it that you see inflation canceling out house price asset devaluation, hence the low now before high inflation starts?Leave a comment:
-
Re: Case-Shiller Housing Charts - Long-term, etc.
The shadow inventory area is by far the roughest thing to judge, and is indeed the key nationally and probably in the most bubbly areas like SoCal, Vega, Florida, etc. too.Originally posted by CanuckinTX View Post
Interesting article, although I wonder about the foreclosure numbers from a data quality standpoint. The ones I track, including CR, show that they peaked last year... and DrHB may have a better track than CR and others do too. WTFDIK definitely applies.
I'm also looking at very high inventory being a mark of a bottom - per step 9 above.
And who knows what the folk in DC (or the weirdos in Sacramento) will do to attempt to pump housing pre election...
Also very interesting on your observation about Riverside having hit bottom. You probably saw the San Diego Case Shiller data - seems like a bottom is in place there, or very close. In the general area of the Rockies where I live, renting a house has been cheaper than renting an equivalent apartment for almost a year.
There's little question in my mind that much of the rest of the country has some great deals - close enough to a bottom or already bottomed to actually purchase - with much care and research and a keen sense of risk issues of course.Leave a comment:
-
Re: Case-Shiller Housing Charts - Long-term, etc.
It's certainly probable that they would bottom soon after or even concurrently, but mostly I'm looking at the extremely low interest rates now and an expectation for even lower rates during the current recession. Best guess, another 5-10% lower on nominal prices is ahead nationally.Originally posted by WDCRob View Post
For what its worth, Dataquick's weekly stats of about 2/3 of total US sales has actually already bottomed. The median home sold for about $184k during the most recent week, and a low of $170k median home price earlier this year was set. Same with their weekly sales index - it bottom around March at about 120k and is up to about 180k recently.
Yes, it's contrary data to other indexes and I can't explain it well, but it is what it is... and there's a very long shot possibility that we have already bottomed nationally.
I want to stress again that this is all tentative, but I sure am seeing more potential of a bottom forming than any time within the last few years.Leave a comment:
-
Re: Case-Shiller Housing Charts - Long-term, etc.
Thanks Bart.
Because I'm fixated on the So Cal market I thought I'd post another great article from Dr. Housing Bubble. The most interesting point in this version is that in Orange Country there are almost as many distressed shadow inventory homes in the pipeline as there are houses listed on the MLS. I'm expecting an overshoot to the downside on the housing prices there which is why I'd expect a return to the nominal early 2000 prices.
http://www.doctorhousingbubble.com/s...le+Feedfetcher
Of course, the So Cal housing market has always been it's own little world. I agree the uber rich that live right on the water probably have a floor under them but the people 1 or 2 blocks in, the FIRE economy recipients or wannabe's, are the ones that over extended themselves to rub elbows there and will likely bear the brunt of price declines the next year or two. Inland places like Riverside probably have hit bottom already considering those buyers had little to no safety net to make payments.Leave a comment:
-
Re: Case-Shiller Housing Charts - Long-term, etc.
Bart, were you saying that the 'monthly payment' would potentially reach a nominal low in Q1 2012? Or that you considered it possible housing would bottom for cash buyers as well?Leave a comment:
-
Re: Case-Shiller Housing Charts - Long-term, etc.
Thanks bart. And you know I love to eat spaghetti charts.
Leave a comment:
Leave a comment: