Re: Case-Shiller Housing Charts - Long-term, etc.
http://www.bloomberg.com/news/2012-0...ecline-4-.html
Home Prices in 20 U.S. Cities Decline 4%
By Shobhana Chandra - Feb 28, 2012 9:43 AM ET
Home prices in 20 U.S. cities dropped more than forecast in December to the lowest level since the housing crisis began in mid-2006, indicating foreclosures are hampering the industry�s recovery.
The S&P/Case-Shiller index of property values in 20 cities fell 4 percent from a year earlier, after decreasing 3.9 percent in November, a report from the group showed today in New York. The median forecast of 31 economists surveyed by Bloomberg News called for a 3.7 percent decline.
Distressed properties returning to the market mean prices will stay depressed, prompting buyers to wait for cheaper bargains and impeding construction. While sales have begun to stabilize, a rebound in home values may take time, underscoring Federal Reserve policy makers� concern that weakness in housing is blunting their efforts to spur the economic expansion.
�We�re still dealing with a lot of distressed properties and very low absolute levels of demand,� said Sean Incremona, a senior economist at 4Cast Inc. in New York, who accurately projected the 4 percent drop. �We�re not seeing any of the stabilization in housing activity filter through to prices.�
A separate report today from the Commerce Department showed orders for U.S. durable goods fell in January by the most in three years, led by a slowdown in demand for commercial aircraft and business equipment.
Three Years
Bookings for goods meant to last at least three years slumped4 percent, more than forecast, after a revised 3.2 percent gain the prior month. Economists projected a 1 percent decline, according to the median forecast in a Bloomberg News survey.
The Standard & Poor�s 500 Index was little changed at 1,367.54 at 9:34 a.m. in New York. The 10-year Treasury yield fell two basis points from late yesterday to 1.90 percent.
Economists� estimates for the year-over-year change in the home price index for December ranged from declines of 4.1 percent to 3.2 percent, according to the survey. The Case- Shiller index is based on a three-month average, which means the December data was influenced by transactions in October and November.
The November reading was previously reported as a year- over-year drop of 3.7 percent.
Home prices adjusted for seasonal variations fell 0.5 percent in December from the prior month, following a decrease of 0.7 percent in November. Unadjusted prices fell 1.1 percent from the prior month.
Shows Trends
The year-over-year gauge, begun in 2001, provides better indications of trends in prices, the group has said. The panel includes Karl Case and Robert Shiller, the economists who created the index.
Nineteen of the 20 cities in the index showed a year-over- year decline, led by a 12.8 percent drop in Atlanta. Detroit showed the only increase, with prices rising 0.5 percent in December.
Nationally, prices decreased 4 percent in the fourth quarter from the same time in 2010 to the lowest level since mid-2006. They fell 3.8 percent from the previous three months before seasonal adjustment, and fell 1.7 percent after taking those changes into account.
�The pickup in the economy has simply not been strong enough to keep home prices stabilized,� David Blitzer, chairman of the S&P index committee, said in a statement. �If anything, it looks like we might have re-entered a period of decline as we begin 2012.�
Demand Steadies
Recent reports indicate demand is steadying. Existing-home (ETSLTOTL) sales rose to a 4.57 million annual rate in January, the National Association of Realtors reported last week. While it was the best showing since May 2010, distressed properties made up the largest portion of all purchases since April.
Toll Brothers Inc. (TOL) and D.R. Horton Inc. are among builders benefiting from job growth as well as cheaper properties and record-low mortgage rates.
�We�re optimistic,� Doug Yearley, chief executive officer at Horsham, Pennsylvania-based Toll Brothers, said in a Feb. 22 interview with Bloomberg Television. �We have orders that are up significantly. We�re seeing deposits up, we�re seeing traffic up.�
Excess supply of distressed properties is dragging down values for all houses. About 5 million houses have been lost to foreclosure in the U.S. since 2006, according to RealtyTrac Inc. Banks may seize more than 1 million U.S. homes this year after legal scrutiny of their foreclosure practices slowed actions against delinquent homeowners in 2011, it said last month.
�Restoring the health of the housing market is a necessary part of a broader strategy for economic recovery,� Fed Chairman Ben S. Bernanke said in the cover letter of a Fed study on the housing market that he sent to Congress last month.
To contact the reporter on this story: Shobhana Chandra in Washington atschandra1@bloomberg.net
-
Re: Case-Shiller Housing Charts - Long-term, etc.
The nominal index basically went nowhere for 2011. After dropping from 31.05% below peak in Q4 2010 to 33.81% below in Q1 2011, it recovered somewhat through the middle of the year, then ended up with a new low (barely) at 33.83% below peak in Q4.

The CPI-adjusted index has set a new low at 41.39% below peak, beating the previous low in Q1 of 40.79%.

Atlanta, Las Vegas, Seattle, Tampa, and the 10-city and 20-city composites are all at new lows, with Chicago and Portland both squeaking by.


In the price tiers data, Atlanta is at new lows for all three categories, Las Vegas is at new lows for low-end and high-end homes, Los Angeles is at a new low for high-end, Miami for low-end, Portland for low and mid, Seattle for low and mid, and Tampa for low and mid.


Leave a comment:
-
Re: Case-Shiller Housing Charts - Long-term, etc.
Another small quarterly increase for Q3 2011, bringing the nominal index to 31.35% below peak, and CPI-adjusted to 39.51% below peak.


Atlanta, Las Vegas, and Phoenix have set new lows. Vegas and Phoenix were minor bumps down, but Atlanta lost nearly 5% from August to September. It could be an error, will have to wait to see if they revise the data.


Breaking into price tiers, Atlanta and Las Vegas show new lows in all three categories, but Phoenix is hovering just above maximum lows.


Leave a comment:
-
Re: Case-Shiller Housing Charts - Long-term, etc.
Lots more housing bubble charts available here..... http://www.australianpropertyportal.com/GalleryLeave a comment:
-
Re: Case-Shiller Housing Charts - Long-term, etc.
Originally posted by Sharky View Postcensus.gov has a series for median lot size, although it only goes back to 1976 so does not give us a long historical view. From the data available, it seems to the lot size has fluctuated up and down, rather than a steady decline in size as we might expect from observing "postage stamp" lots in some newer developments.Originally posted by bart View Post

Adjusting for inflation, using 2010 dollars (consistent with charts I posted earlier in this thread showing price per square foot of the house itself), the price per lot square feet has risen and fallen with the overall price of the new home.

Of course a national median lot size smooths out extremes at both ends. Lot sizes in different parts of the country, as well as urban vs suburban vs exurban areas vary considerably. The national median lot size in 2008 (last reported year in the series) is 8,854 square feet. The standard residential lot size in my city, Portland, has been 5,000 square feet since the 1866 platting, well below the median. Yet in many parts of the country, particularly in suburbs, lot sizes are closer to the median, or even larger.
Originally posted by zoog View PostLast edited by zoog; September 04, 2011, 03:09 PM.Leave a comment:
-
Re: Case-Shiller Housing Charts - Long-term, etc.
Yes, median house size is bigger now but the amount of land is smaller too.Originally posted by Sharky View Post
Unfortunately, I don't track any of the square footage indexes so can't positively comment in the area. I also don't know if they take amount of land into account.Leave a comment:
-
Re: Case-Shiller Housing Charts - Long-term, etc.
thanks for those graphs, zoog. They are interesting.
Do you think there are a lot of people on the fence? Are they waiting for cheaper rates?If rates start to move up, everyone on the fence will buy.
I suspect there will be fence sitters who buy. Are their numbers large enough to make a dent?Leave a comment:
-
Re: Case-Shiller Housing Charts - Long-term, etc.
Thanks, bart.
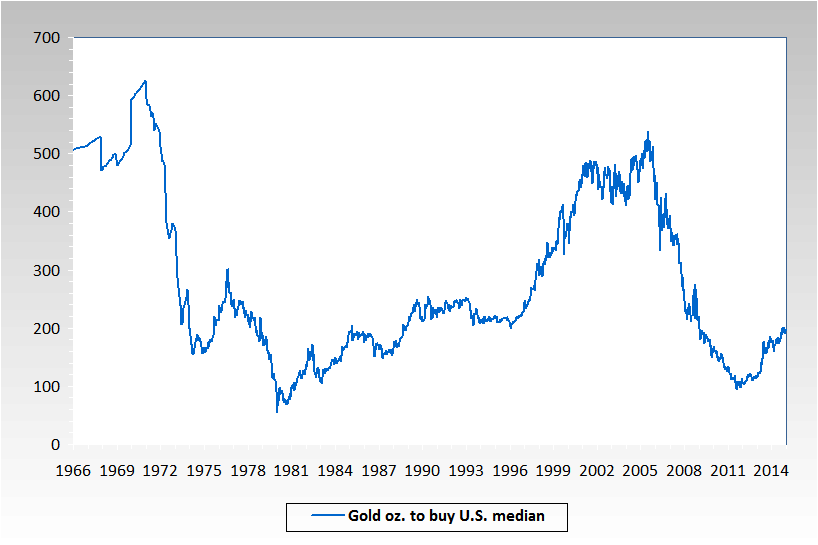
Even though the trend is still down, I have to say that the 100 oz per house point looks like an awfully tempting point to start thinking about making a switch.
Are current median homes larger than they were at the last minimum in 1979? Does the data look much different based on price per square foot vs. gold, rather than total price?Leave a comment:
-
Re: Case-Shiller Housing Charts - Long-term, etc.
Does anyone have a good chart showing the ratio of the median home price to the price of gold?
Any thoughts about what it means for us to be at a relatively low point in that cycle? Is there a point at which you would trade gold for RE?Leave a comment:
-
Re: Case-Shiller Housing Charts - Long-term, etc.
If rates start to move up, everyone on the fence will buy.Leave a comment:
-
Re: Case-Shiller Housing Charts - Long-term, etc.
Generally, but the effect is not usually all that pronounced, especially after backing out the usual increase in home prices from one year to the next. (Of course in recent years that overall change has usually been negative.) The volume of homes sold, however, definitely increases in the summer.Originally posted by aaron View Post
Yes, but in most places, summer usually provides the best house-hunting and moving weather, and that tends to draw more people into the market, whether they have kids or not. In closed sales counts (the house has actually sold and passed ownership), what is usually more pronounced than summer vs. spring is January vs. the rest of the year; few people are out buying houses between Thanksgiving and New Years. Plus a lot of houses get pulled off the market in late December and wait until early spring to relist, giving the house a new listing number and showing up as a new entry in the brokers' lists. (I think some MLA's have started to crack down on that a little.)Originally posted by aaron View Post
Not sure how enlightening that really turns out to be. Everyone knows that houses are bigger now than they used to be, but the nominal price per square foot of new homes has continued to climb as well.Originally posted by aaron View Post

Adjusting for inflation provides a different picture, however. Since the 1960's, new home prices per square foot have oscillated in a flat range. The cheapest time to buy a house by this measure was immediately following the end of WW II.

I don't really follow the Seattle market, but, using Shiller's conclusion that houses track inflation over the long term and should return to that relationship, I believe Portland is still overvalued by 15-20%. Using rent/own calculations, I believe it is about 10% above the late 1980's low. Using a price/income ratio, it is about 75% above the late 1980's low (lol?), but is quite near the average.Originally posted by aaron View PostLeave a comment:
-
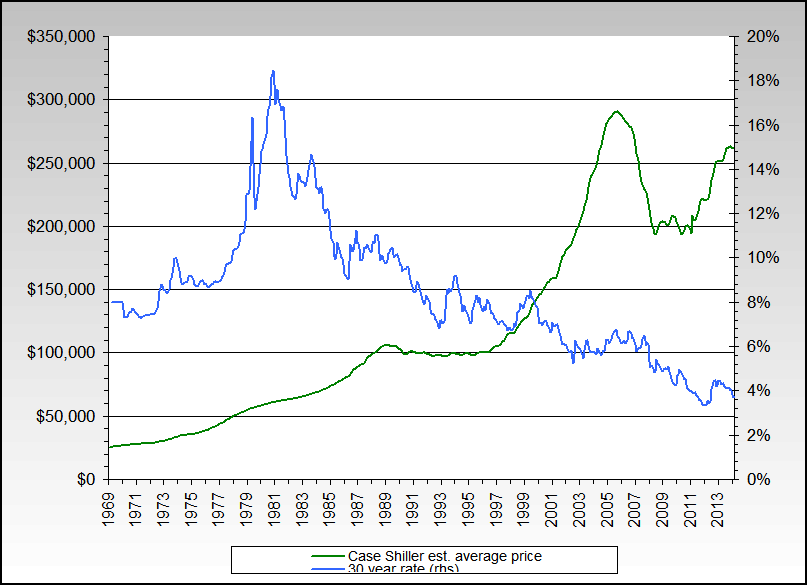
Re: Case-Shiller Housing Charts - Long-term, etc.
So, there is no correlation between interest rates and home prices ? From 1976 to 1986, interest rate went from ~8% to 18% to 8%, but the home prices continued to rise.Originally posted by bart View PostLeave a comment:
Leave a comment: