Re: Jobs crash arrives on schedule - Eric Janszen
What will the impact be on unemployment stats when Obama's jobs programs get going? Fewer people out of work in the short term, and more in the long term?
I've noticed a few places that they're starting to talk about "providing or saving" three million jobs -- an obvious political out in the event that unemployment continues up after the program is in full gear.
Also, does anyone else sense an impending change in the way unemployment numbers are calculated? After all, if Clinton can do it, why can't Obama -- especially since he's basically bringing the whole Clinton team back with him. It's a lot easier to win with statistics if you can fudge the numbers.
Announcement
Collapse
No announcement yet.
Jobs crash arrives on schedule - Eric Janszen
Collapse
X
-
Re: Jobs crash arrives on schedule - Eric Janszen
why doesn't Fred answer the question: 12% or 20%? Please don't parse the answer with references to old stat formulas. Do you have different opinions? Have you revised your estimate?
Leave a comment:
-
Re: Interactive Unemployment Timeline Map - MSNBC
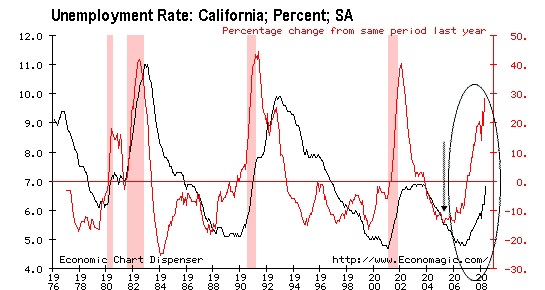
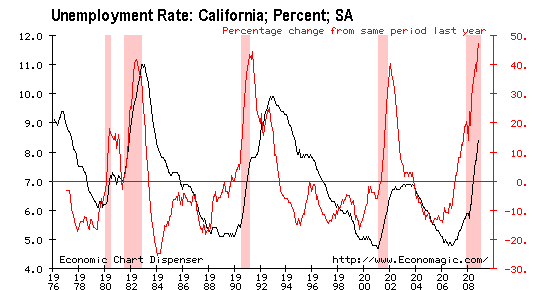
like this?Originally posted by RickBishop View PostI think that California (the place i love) will be at 14% unemployment at the end of 09 jmho
Forecast July 2008

Ground Zero state
National Unemployment Growth Rank: 4
Macro-economic Vulnerability: High
Unemployment Growth Rate: High
Estimated Post Recession Peak Unemployment Rate: 10%
Future Home Values Rating: Poor
Actual January 2009

Reassessment: With unemployment already pushing 8.5% from 6.5% at the time of our previous forecast, we are revising our forecast for CA unemployment to peak at 12% versus 10%.
Leave a comment:
-
Re: Interactive Unemployment Timeline Map - MSNBC
I think that California (the place i love) will be at 14% unemployment at the end of 09 jmhoOriginally posted by zoog View PostHere's an interactive unemployment timeline map of the USA showing unemployment by state for the past year or so, currently up through November 2008.
http://www.msnbc.msn.com/id/27913794/
As of the November data, California, Oregon, Michigan, South Carolina, and Rhode Island are the worst with unemployment in the 8-10% range. Throughout the post tech bubble recession, Oregon had the highest or second highest unemployment in the country, peaking at 8.5% in 2003. We're already at 8.1% and I have no reason to believe we won't be at or near the top this time too.
Leave a comment:
-
Re: Jobs crash arrives on schedule - Eric Janszen

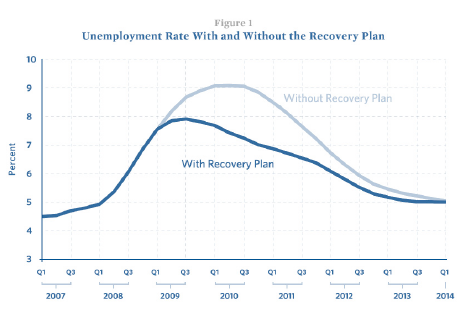
So the Obama administration predicts his recovery plan will keep the peak in unemployment around 8% in Q3 2009 after which it drops to 5% by mid 2013.
Leave a comment:
-
Interactive Unemployment Timeline Map - MSNBC
Here's an interactive unemployment timeline map of the USA showing unemployment by state for the past year or so, currently up through November 2008.
http://www.msnbc.msn.com/id/27913794/
As of the November data, California, Oregon, Michigan, South Carolina, and Rhode Island are the worst with unemployment in the 8-10% range. Throughout the post tech bubble recession, Oregon had the highest or second highest unemployment in the country, peaking at 8.5% in 2003. We're already at 8.1% and I have no reason to believe we won't be at or near the top this time too. Last edited by zoog; January 14, 2009, 05:46 PM. Reason: oops forgot Rhode Island, it's so teeeny on the map
Leave a comment:
-
Re: Jobs crash arrives on schedule - Eric Janszen
The vowel endings have it! Obama agrees with Roubini!
This is beyond disappointing to me. The data and analysis for unemployment projections presented by iTulip is very convincing. I see no logical explanation that could conclude that unemployment would peak at 8.8% without a plan and 8% with a plan.
This indicates that the people that President elect Obama has surrounded himself with have won the day. The Plan indicates that if we take the same old steps you would in any Recession (tax cuts, infrastructure spending, unemployment extensions), we can recover the FIRE economy and everything will return to normal. Unless this plan gets changed dramatically toward more Alt-E development and transport, you better have a parachute because we are stepping off the cliff.
http://otrans.3cdn.net/ee40602f9a7d8172b8_ozm6bt5oi.pdfReal GDP (billions
of chained 2000 $) Payroll Employment
Without Stimulus $11,770 133,876,000
With Stimulus $12,203 137,550,000
Effect of Package Increase GDP by 3.7% Increase jobs by 3,675,000
Source: Authors’ calculations based on methodology described above and multipliers
described in Appendix 1.
The table shows that we expect the plan to more than meet the goal of creating or saving 3 million
jobs by 2010Q4. There are two important points to note, however:
First, the likely scale of employment loss is extremely large. The U.S. economy has already lost
nearly 2.6 million jobs since the business cycle peak in December 2007. In the absence of stimulus,
the economy could lose another 3 to 4 million more. Thus, we are working to counter a potential
total job loss of at least 5 million. As Figure 1 shows, even with the large prototypical package, the
unemployment rate in 2010Q4 is predicted to be approximately 7.0%, which is well below the
approximately 8.8% that would result in the absence of a plan.

Leave a comment:
-
Re: Jobs crash arrives on schedule - Eric Janszen
This will add a bit more to what Verrocchio called to attention. http://www.financialsense.com/fsu/ed...2009/0109.html 1/9/09
Originally posted by Sy Harding, newsletter writerMeanwhile, comparisons to the number of jobs lost in previous periods, particularly to the 1940ís and 1950ís are misleading and fear-mongering. The population and labor force were considerably smaller then, so similar job loss numbers in those decades represented a much larger percentage of the work force.
The loss of jobs in the current cycle, as bad as they sound and have been, has only returned the labor force to its level of February, 2006, a level of employment that had the economy humming along quite nicely thank you.
However, more importantly, the employment picture is not the place to look for early signs of the economy bottoming anyway. Employment is a lagging condition in both directions. Remember how employment remained strong right through last summer, which had economists (and the Fed) saying there would be no recession because employment remained strong, even though as we now know, the recession had begun in December, 2007.
In the other direction, as always the stock market (which always looks ahead six to nine months) will have already recovered significantly before the recession bottoms and the economy begins to recover. And the economy will have already recovered significantly before employment will begin to pick up again.
But as always, investors and TV analysts worry a lot about the employment numbers, not only legitimately about what they are saying about the economy, but uselessly what the jobs numbers are saying about the stock market going forward.
For instance, letís go back and see how the stock market fared after the previous terrible monthly job losses to which the December numbers are being compared.
When that horrible report of September, 1945 was that 2 million jobs had been lost, the stock market had already bottomed in 1944, and was up 35%. After the jobs report it added another 17% over the next five months. When the terrible report in October, 1949 was that 834,000 jobs had been lost that month, the stock market had already bottomed in June and was up 12% when the report came out, and then added another 22% over the next seven months. When the terrible report came out in December, 1974 that 602,000 jobs had been lost that month, the stock market bottomed three days later, and the Dow gained 53% over the next ten months.
By all means market-timing is going to continue to be important if you are to make, and keep, profits from the market. But the jobs picture has no place in timing the stock market.
Leave a comment:
-
Re: Jobs crash arrives on schedule - Eric Janszen
I've heard this comparison made, too, and couldn't decide if the speaker was mentally lazy or deliberately misleading his audience. The counting issue alluded to above is an issue, of course, but the comparison is useless, as stated, even if the official and real numbers were much closer at both points in time.:rolleyes: National population in the US in 1946 was estimated at 132,481,000, and the July 2008 estimate is 303,824,640. The USA is not yet close to the unemployment problem it experienced in 1945, although it seems to be heading there in a hurry.Originally posted by GRG55 View PostIt's not just Roubini. After the BLS jobs report came out today, how many economists were lined up on financial TV to explain why "it's the bottom"? I don't know about you folks, but after one hour of replays tonight I've already lost count...
The favourite statistic to quote in support of this position is the comparison of 2.6 million "official" job losses in 2008 vs the worst post-WWII experience of 2.8 million in 1945. Nobody, absolutely nobody [Taleb excepted, maybe?] is ready for the level of job losses in 2009 that iTulip is expecting.
Leave a comment:
-
Re: Jobs crash arrives on schedule - Eric Janszen
I don't think there is as much deliberate malice among economists, or sheer incompetence in the media as some of us here may believe. A lot of what is now going on in the population at large, and within the media, strikes me as quite normal for humans actually.Originally posted by metalman View Postbut if they read itulip's analysis it's friggin obvious... inescapable... where's the disconnect? why don't other economists challenge itulip? take on ej mano y mano.
oh, yeh, now i remember... Are We Idiots? - iTulip.com... not begging for an asshanding.
The response to all the recent "worst in decades" economic data reminds me of the stories that came out after Chernobyl. Scientists and operations personnel were found wandering in the wreckage, staring at chunks of radioactive graphite from the reactor strewn all about, and not at all comprehending what had happened. All of their training and experience convinced them that such a thing could never happen. Classic cognitive dissonance.
All of our "training and experience" is that a truly severe economic contraction simply cannot happen. After all we have "social safety nets", and regulations, and Keynesian economic theory, and a Federal Reserve headed by someone who is an expert on the Great Depression, and all these other things that were not in place in the 1930's. So how could this possibly be happening?
Leave a comment:
-
Re: Jobs crash arrives on schedule - Eric Janszen
What about the shadowstats "SGS alternative" where
The SGS Alternate Unemployment Rate reflects current unemployment reporting methodology adjusted for SGS-estimated "discouraged workers" defined away during the Clinton Administration added to the existing BLS estimates of level U-6 unemployment.
Leave a comment:
-
Re: Jobs crash arrives on schedule - Eric Janszen
but if they read itulip's analysis it's friggin obvious... inescapable... where's the disconnect? why don't other economists challenge itulip? take on ej mano y mano.Originally posted by GRG55 View PostIt's not just Roubini. After the BLS jobs report came out today, how many economists were lined up on financial TV to explain why "it's the bottom"? I don't know about you folks, but after one hour of replays tonight I've already lost count...
The favourite statistic to quote in support of this position is the comparison of 2.6 million "official" job losses in 2008 vs the worst post-WWII experience of 2.8 million in 1945. Nobody, absolutely nobody [Taleb excepted, maybe?] is ready for the level of job losses in 2009 that iTulip is expecting.
oh, yeh, now i remember... Are We Idiots? - iTulip.com... not begging for an asshanding.
Leave a comment:
-
Re: Jobs crash arrives on schedule - Eric Janszen
It's not just Roubini. After the BLS jobs report came out today, how many economists were lined up on financial TV to explain why "it's the bottom"? I don't know about you folks, but after one hour of replays tonight I've already lost count...Originally posted by FRED View PostHow can unemployment peak at 9% in two years when unemployment is already 7.2%, up from 5% a year ago? Doesn't make sense. Roubini needs to sharpen his pencil and run the numbers again.
The favourite statistic to quote in support of this position is the comparison of 2.6 million "official" job losses in 2008 vs the worst post-WWII experience of 2.8 million in 1945. Nobody, absolutely nobody [Taleb excepted, maybe?] is ready for the level of job losses in 2009 that iTulip is expecting.Last edited by GRG55; January 09, 2009, 09:21 PM.
Leave a comment:
-
Re: Jobs crash arrives on schedule - Eric Janszen
Up until 1994, the official unemployment rate was U-5:Originally posted by lakedaemonian View PostMay I ask what 20% using today's unemployment definition methodology equates to the methodology used in the 70's-80's?Total unemployed persons, as a percent of the civilian labor forceStarting in 1995, the official unemployment rate was U-3:Unemployed persons aged 25 and older, as a percent of the civilian labor force aged 25 and older(See Alternative unemployment measures, BLS, 1995.)
Later U-3 became the official unemployment rate, the definition of U-3 became more like the old U-5 but the definition of "unemployed" also changed."Marginally attached workers are persons who currently are neither working nor looking for work but indicate that they want and are available for a job and have looked for work sometime in the recent past. Discouraged workers, a subset of the marginally attached, have given a job-market related reason for not currently looking for a job. Persons employed part time for economic reasons are those who want and are available for full-time work but have had to settle for a part-time schedule." - BLSThere is no apples-to-apples comparison between unemployment rates reported as standard in the 1970s/1980s and today. If we had to say, the old U-5 is probably between the new U-5 and U-6. We'd tell you what the numbers are but the database is currently down (see Bureau of Labor Statistics). Perhaps 9% to 10%?
Leave a comment:
-
Re: Jobs crash arrives on schedule - Eric Janszen
May I ask what 20% using today's unemployment definition methodology equates to the methodology used in the 70's-80's?Originally posted by FRED View PostAre you confusing the year? The 20% forecast is for 2010 not 2009.
Leave a comment:
Leave a comment: