Net Det and Equity composition of the aggregate S&P500...

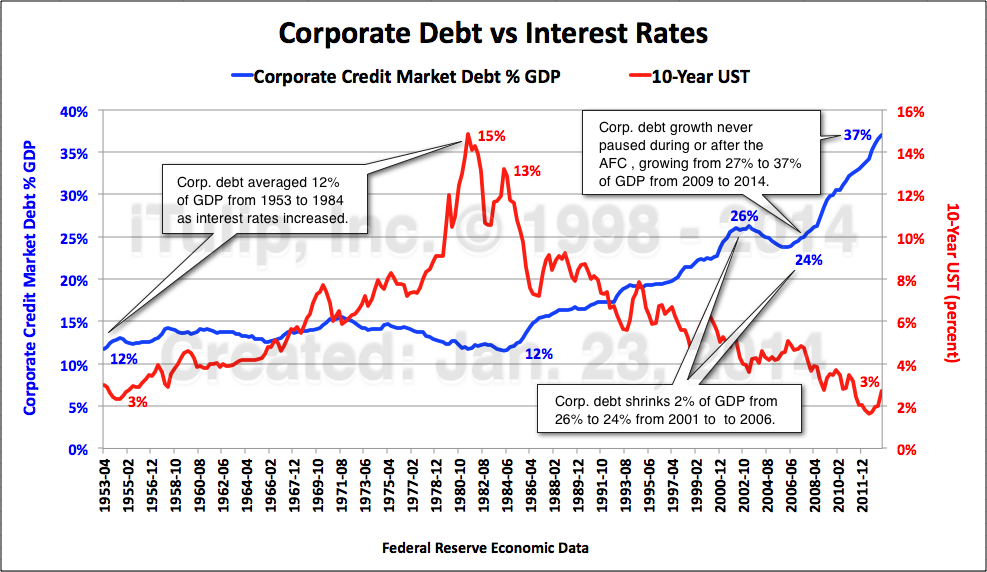
EJ - The confusion I have with this is outlined in my chart above... Net Debt has been consistently declining across all listed S&P500 stocks since the financial crisis.
Your explanation sounds to me as if there is rapid growth in bond market credit. The only way I can reconcile such growth, alongside corporate balance sheet de-leveraging (as shown by my chart above), is that not only are balance sheets of listed corporates getting better, but the debt mix is also shifting - from bank debt, to bonds. This is what I am also seeing in Australian listed corporates, especially REITs. The motivation is to move away from bank debt where companies can at best get 3-5 year debt, and increase avg debt tenor by moving in to bond markets. This was a lesson learned the crisis from not having long-term debt to match long-term assets.
So in summary, your chart explains how more corporate credit is being issued - but when combined with my chart, it shows that it's a "mix of debt" shift away from bank debt, as opposed to a re-leveraging of the corporate sector.
EJ, would you agree/disagree with this explanation? I am really keen to understand where I might be wrong.
Your thoughts are much appreciated,
Damon


Leave a comment: