 Tweet
Tweet
 |
� Slowed by green parachutes
� Bond market suspends disbelief
� Why China is nervous
We have all heard that the U.S. economy cannot go the way of Argentina in 2001 when foreign investors expressed lost confidence in the government and refused to roll over maturing short-term government bonds. Money fled the country as foreign currency reserves dwindled. A balance of payments crisis facilitated by investor panic led to the very outcome investor�s feared: the world�s largest ever sovereign bond default, a collapsing currency, and hyperinflation.
That can never happen here in the U.S., we are told. The U.S. owes its foreign debts in its own currency. U.S. lenders will never shoot themselves in the foot by allowing a dollar debt and currency crisis to develop because they depend on the U.S. for trade to support their own domestic economies. Foreign central banks, such as the People's Bank of China, will continue to step in to rescue the U.S. They will not fail the U.S. as the IMF failed Argentina. They will keep buying U.S. debt forever no matter how large U.S. fiscal deficits become, or how much bad debt the Federal Reserve takes onto its balance sheet, or how long it takes for the U.S. economy to recover.
But this is no more than an argument that the U.S. is not likely to experience a replica of an Argentina 2001 debt and currency crisis, and of course that is true. But that does not mean that a related, equally unseemly but fundamentally different catastrophic result may follow from similar causes and crisis triggers. Evidence abounds that the U.S. is trapped in a cycle of economic contraction and declining creditworthiness from which an Argentine style default with U.S. characteristics is all but inevitable.
Here we take a deep dive into the macro economics of the Argentine crisis�GDP growth, consumption, investment, inflation, industrial production, unemployment and a dozen other details of the Argentine economy in the period before it collapsed at the end of 2001. We compare the same macro economic measures during the U.S. economic crisis that started in 2008.
A few items, such as currency reserves, stand out in ways that show how different the U.S. situation is now from Argentina�s then, but most of the macro economic comparisons reveal astonishing similarities, especially measures of output and inflation.
Argentina and Ka-Poom Theory
We had not re-visited the case of Argentina since 1998 when we developed our now ten-year-old Ka-Poom Theory. We did so because simplistic Keynesian and monetarist models of inflation and deflation neglect the critical factor of capital flows on net debtor economies like the U.S. and Argentina in crisis. In the kind of crisis that is most likely to grip the U.S. with anything but fleeting economic troubles, capital flows become the only economic factor that matters and others that monetarists dwell on, such as bank credit, become irrelevant. "Inflation is always and ever a monetary phenomenon" is great marketing for hawkish monetary policy but lousy economics.
We needed our own theory because we wanted to know what to do with the proceeds of investments in technology companies that we planned to liquidate before the stock market bubble we were in at the time collapsed, which bubble was also a theory to most in 1998 but was to us a fact, its collapse an inevitability to be timed not debated.
Ka-Poom Theory lays out an economic process. It begins with a post credit bubble economic collapse, such as occurred in 2000 and again in 2008, that immediately results in debt deflation and a contraction in bank credit. The credit contraction then spills over into the real economy to produce monetary deflation as demand and output fall. But the period of deflation is brief because the economics orthodoxy of our time calls for radical and immediate fiscal and monetary policy action to slow the contraction of money and credit and boost demand.
We call this part of the Ka-Poom process �disinflation� to distinguish it from the self-reinforcing process of monetary and credit deflation that gripped the U.S. in the 1930s, aka a deflation spiral. No deflation spiral has never occurred anywhere else ever since, yet many economists still opine on deflation spirals and liquidity traps, as if gold backing still held back credit and money expansion as it did in the early 1930s. These economists apparently have not noticed that even during the gold standard era any government wishing to produce money to pay for war first went off the gold standard�temporarily of course�after which money and inflation appeared in abundance no matter the circumstances of the economy, high unemployment or low, high debt levels or low. Since the 1930s governments skip the step of dropping off the gold standard and go right to the printing, and for any number of political purposes other than war. Many have to excess, with Zimbabwe as the most recent and illustrious example. Deflation is the penultimate red herring of modern central banking.
The second inflationary part of the Ka-Poom process occurs if re-inflation of a crashed economy by fiscal and monetary stimulus goes haywire for reasons of trade and finance, as in the case of Argentina in 2001 and dozens of other indebted nations throughout the world before and several since.
Worth noting: in 1998 we used the early 1990s Argentina inflation crisis as one of our models for Ka-Poom Theory as the 2001 version was not yet available. In 1998 the early 1990s Argentina hyperinflation was already a distant memory, and economics papers of the time lauded Argentina�s economic stabilization program that brought inflation down to low single digits. We did not know at the time that Argentina was set up for a recurrence of its 1990s debt crisis and inflation. Paradoxically, the collapse of U.S. stock market bubble in 2000 caused a U.S. recession that spread to Argentina, among other places in the world, and that recession was itself a catalyst for the 2001 Argentine crisis that resulted in hyperinflation there.
Our readers understand economics as an ongoing process rather than a series of disconnected events as deflation and inflation are usually presented. It is not either deflation or inflation, here it is one then the other. The axiom of Ka-Poom Theory, that defines a specific economic, trade, and finance process that occurs under circumstances unique to our time, is that the appearance of a sharp period of deflation after a bubble collapses is in and of itself a warning sign of potential impending out-of-control inflation. That is why we give it a special name disinflation to distinguish it from deflation.
To understand why disinflation in a post-bubble context points to a period of future high inflation we compare the 2000 and 2001 Argentine economy to the economy we are sit inside today here in the U.S. The U.S. escaped the high inflation �Poom� phase in 2002 by dint of the Greenspan credit bubble that produced the housing bubble and others. Will we escape again?
Ben Bernanke 2009 cannot play Paul Volcker 1980
Even as oil and other prices rise to price in future inflation from the Fed�s and Congress� re-inflation policies, current chairman Ben Bernanke cannot in 2009 raise interest rates as Paul Volcker did in 1980. Conditions then�low unemployment, positive GDP growth, and high inflation�are the precise opposite of those that prevail here in the middle of our FIRE Economy Depression.
Argentina's economy started to blow up when its fiscal deficit exceeded 3% of GDP in 2001 and its gross external debt, the majority of it short term, exceeded 55% of GDP while the nation fell into recession. The recession reduced the nation's economic output and thus its ability to earn income to repay its foreign debts.
The CBO projects the U.S. fiscal deficit at 12.3% in 2009, and increasingly short-term external debt now exceeds 100% of GDP. Meanwhile GDP is shrinking. U.S. Q1 2009 GDP growth came in at minus 6.3% and 5.5% in Q1 2009, setting the stage for an Argentina type crash, but with American characteristics. In fact, if the U.S. were any other country that owed so much to so many but in foreign currencies we�d have seen a �Poom� inflationary event long ago.
The fact that the U.S. owes its foreign debt in dollars only limits the extent and speed of an Argentina type economic crisis for the U.S. Counter intuitively, if monetary and fiscal policy today allowed the money supply to fall, and demand and economic output to decline further, and CPI inflation to fall below 2% or so, a debt and currency crisis for the U.S. is virtually assured.
If Bernanke pulled a Volcker today, raising interest rates and cutting the money supply, he�d launch a process to send the U.S. economy into a hyperinflation.
The circumstances facing the U.S. today and in 1980 are apples and oranges.
The Paul Volcker Fed raised interest rates when unemployment was low and falling, and inflation was high and rising. Today unemployment is high and rising, and inflation low and falling, although rising long term interest rates and commodities are pricing in future inflation.
With high unemployment and negative GDP, how can the Fed raise interest rates? In this environment high interest rates are the greatest risk to economic growth and output, and thus U.S. ability to repay debts. If the idea of raising them is to reduce inflation and interest rates, we will see the opposite of that intended result. That is why we do not expect to see short term interest rates raised until early 2011, but expect to see long term rates as high as 7% by the end of 2010.
Eerie Timely Parallels between Argentina and the U.S. economies
Argentina�s economy collapsed at the end of 2001 after a decade of mismanagement of the political economy led to a year of financial and economic turmoil that culminated in sovereign debt default, collapse of the currency, and hyperinflation.
As much as the Argentina economy may appear on the surface to not apply to the U.S.--Argentina is not a superpower that issues the world�s leading reserve currency--basic laws of economics, trade, and finance can be stretched but not broken.
Argentina broke several laws in the year 2001 and paid dearly for it. The U.S. between mid 2008 and 2009 broke more than one economic law, aggressively flaunted others, and is on the verge of breaking several more. We cannot accept uncritically the conceit that U.S. geopolitical advantages give our economy a permanent get out of jail free card. Thresholds of tolerance may be exceeded, we just don�t know exactly where they are. We are getting close if Chinese officials are openly discussing alternatives, and this airing of grievances is in fact part of the leading edge of the "Poom" process as in Argentina in the period before the actual crisis.
The latest: A top Communist Party research chief said Thursday that China should buy gold and U.S. real estate rather than Treasuries, according to a Reuters report.
Why China is nervous
Three charts out of dozens we show you in Part II lay out our case.
Argentine Inflation 1995 - 2009
In the year before the bond default in December 2001 and ending in late 2003, CPI inflation increased from -4% deflation to 120% inflation on an annual basis. Here at iTulip we call this process a �Ka-Poom� of deflation and inflation.
The Argentine peso, un-pegged from the U.S. dollar, collapsed by 73% in a few months, and over the next two years inflation wiped out savings and erased all debts.
The Argentine peso, un-pegged from the U.S. dollar, collapsed by 73% in a few months, and over the next two years inflation wiped out savings and erased all debts.
Argentine Exchange Rates 1995 - 2009
The bond market disintegrated.
Argentine Bond Market 1995 - 2009
A U.S. bond crisis will never get this bad, but then it doesn�t need to for bond holders to lose most of their money.
In Part II we show you how many developments in the U.S. economy since 2008 bear striking similarities to the antecedents of the Argentine crisis in 2001, and a few key differences. The grandfather of such crises: out of (political) control fiscal deficits.
All government debt and currency crises are rooted in runaway fiscal deficits. Each nation has its own threshold, depending on trade balance, size and composition of external debt, currency reserves, and other factors. Argentina�s threshold in 2001 was 3% of GDP.
Argentine Fiscal Surplus/Deficit 1995 - 2009
Argentina�s quarterly fiscal deficit threshold before triggering a crisis: 3% of GDP
Compared to the U.S. projected fiscal deficit of 12.3% in 2009, Argentina�s government spending in 2001 was austere. In March 2009 we projected a worse case U.S. fiscal deficit of 8% in 2009 and 12% in 2010. As usual, we were optimistic.
Inflation before and after a Ka-Poom event
You might think that before Argentina�s economy blew up in a hyperinflationary conflagration that the central bank over-expanded the money supply leading to high inflation, and that the inflation spooked foreign investors. But as you may have already guessed from the first chart that shows negative and falling CPI going into the crisis, the opposite is true: the money supply fell in the year leading up to the crisis even as bond prices fell and yields increased.
Here at iTulip we refer to this as the �Ka� or �disinflation� phase of the Ka-Poom deflation-inflation process.
The economy was caught in a vicious cycle of declining economic output and negative credit expansion. The bond markets demanded higher interest rates to compensate for higher default risk. Credit contracted even more, and further reduced economic output. This is the liquidity trap that the Fed hopes to avoid by purchasing long-term debt directly to hold down long-term interest rates. Unfortunately, as in Argentina in 2001, it appears to not be working; 10-year Treasury bond interest rates are up 200 basis points so far this year. The mistake is to think that for a net debtor that failed to escape from a liquidity trap is headed toward a deflation spiral as in the U.S. in the 1930s. Ka-Poom Theory forecasts the opposite outcome.
Where is the U.S. in the Ka-Poom deflation-inflation process? Is the U.S. economy in the kind of deflationary crisis that led to a hyperinflationary outcome for Argentina in 2001?
U.S. Economy reaches terminal velocity
Here on earth falling objects accelerate at a rate of 32 feet per second per second until the downward force of gravity equals the upward drag force of the surrounding air. A man, for instance, who leaps from an airplane, arms outstretched, stops falling faster after reaching a terminal velocity of approximately 120 miles per hour after hurdling for15 seconds. He hasn�t landed�he�s still falling�but no at least his rate of descent is not still increasing.
Different falling objects have varying maximum speeds depending on shape and density. So it is with the many measures of our economy that are hurdling toward the ground after our financial system blew up in 2008.
Keep this in mind when you read the economic news items such as yesterday�s that sent the stock market up.
Durable goods orders rise for second straight month in May
June 24, 2009 (Martin Crutsinger, AP Economics Writer)
WASHINGTON (AP) -- Orders to U.S. factories for manufactured goods from computers to aircraft surged in May for a second straight month. And a gauge of business investment rose last month by the most in nearly five years.
Together, the data Wednesday signal that the recession could be at or near a bottom.
Here are the durable goods data that caused all the excitement.June 24, 2009 (Martin Crutsinger, AP Economics Writer)
WASHINGTON (AP) -- Orders to U.S. factories for manufactured goods from computers to aircraft surged in May for a second straight month. And a gauge of business investment rose last month by the most in nearly five years.
Together, the data Wednesday signal that the recession could be at or near a bottom.
Recession bottom? Maybe so or maybe not. The collapse in Durable Goods Orders appears to have finally achieved an economic �terminal velocity� of -25% year over year.
Here we look for a rise in production resulting from an increase in orders. How about Durable Materials Production?
Here we look for a rise in production resulting from an increase in orders. How about Durable Materials Production?
Terminal Velocity of Durable Materials Production: -33%?
So far, Durable Materials Production continues in freefall with no sign of slowing. But orders are picking up, so maybe if in the next few months orders are not held up or canceled manufacturers may turn these into actual production. If so we can expect to revisit Durable Materials Production over the next few months and see it rising or at least no longer in free fall.
Durable Materials Production covers both household and business sector spending. An economy like the U.S. economy that is more than 70% based on consumer spending can�t recover without a rise in consumer demand. Producers are watching closely, ready to pounce on increased demand. This should show up right away as a rise in Durable Consumer Goods production. Has it?
Durable Materials Production covers both household and business sector spending. An economy like the U.S. economy that is more than 70% based on consumer spending can�t recover without a rise in consumer demand. Producers are watching closely, ready to pounce on increased demand. This should show up right away as a rise in Durable Consumer Goods production. Has it?
Terminal Velocity Durable Consumer Production: -28%
While still negative, consumer goods production bounced last month as it usually does at the end of a recession. But then it may be heading back down again. To get further evidence that this change may indicate a more lasting trend change, we check into Total Business Inventories. Have they slowed their rate of descent?
Terminal Velocity of Business Inventories: -$80 billion?
The rate of increase in the decline in business inventories has not let up yet. For further clarification we check into Final Sales of Domestic Purchasers.
Terminal Velocity of Final Sales: -$340 billion?
Final Sales is GDP minus the change in business inventories. It is the same as PCE, private fixed investment, government consumption expenditures, and gross investment, all added together with net exports of goods and services.
This very comprehensive measure is giving us an ugly still-in-free-fall reading. The number is not only huge but is the very first negative reading on record since the end of WWII.
FIRE Economy Depression Version 2.0
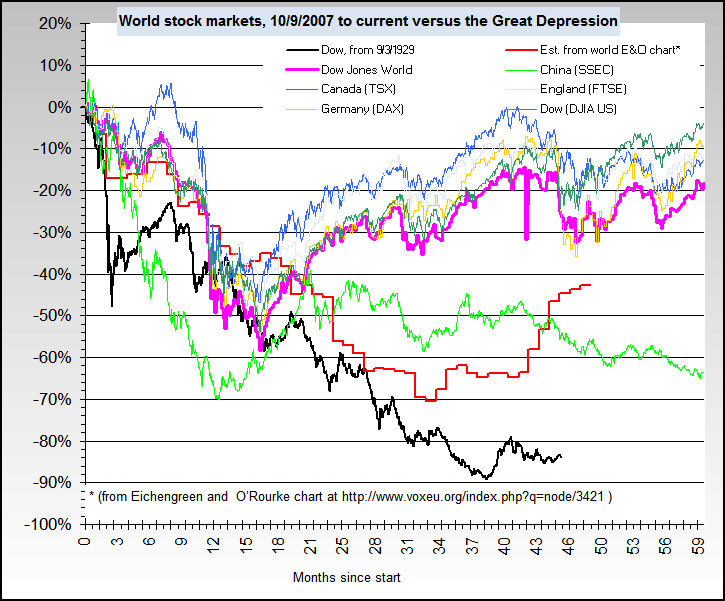
In every respect this depression is worse than the one that preceded WWI, with world stock markets and trade falling far more quickly in the year since April 2008 than occurred during the first year of The Great Depression.
This very comprehensive measure is giving us an ugly still-in-free-fall reading. The number is not only huge but is the very first negative reading on record since the end of WWII.
FIRE Economy Depression Version 2.0
In every respect this depression is worse than the one that preceded WWI, with world stock markets and trade falling far more quickly in the year since April 2008 than occurred during the first year of The Great Depression.
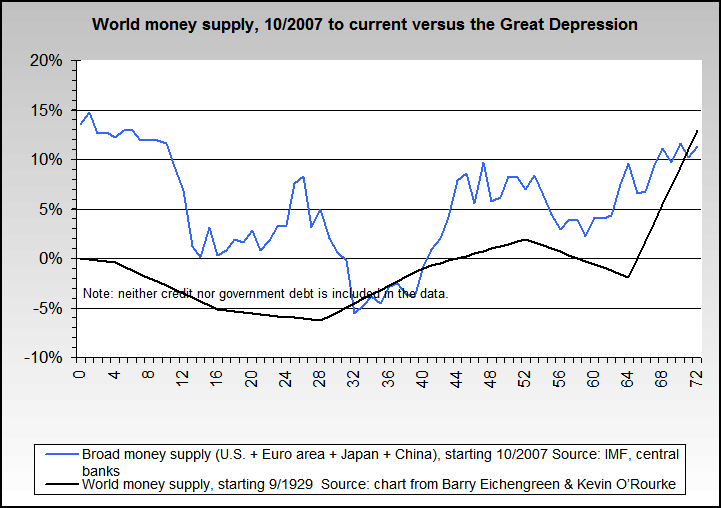
Central bankers believe that the only policy error that central banks and governments made in the early 1930s that resulted in The Great Depression was to fail to counter debt deflation with sufficient monetary and fiscal stimulus quickly enough, to supply parachutes of money to slow the descent of the economy. That�s the theory, and so the major difference between the first year of this economic collapse and the 1930 version is the scale of cash injections into the economy via monetary and fiscal policy.
Global Money supply growth 1930s vs 2008
Global fiscal deficits 1930 vs 2008
Credit: A Tale of Two Depressions
Will it work for the U.S.?
If there is one place to watch the Bernanke Fed�s great experiment play out this year, it is here in the measure of Personal Consumption Expenditures (PCE).
If there is one place to watch the Bernanke Fed�s great experiment play out this year, it is here in the measure of Personal Consumption Expenditures (PCE).
Terminal Velocity of PCE: -$200 billion?
During the FIRE Economy Depression, PCE registered its first ever year over year negative growth rate. After a bounce off -$100 billion last month, this month PCE resumed falling and is now at -$150 billion. We�ll return in a month to see where we are. If it is lower still, watch out. That means the U.S. economy may still be trapped in a vicious Argentina 2001 type of production-consumption down cycle.
Naturally, PCE cannot rise at a sustained pace until unemployment has stopped rising.
Naturally, PCE cannot rise at a sustained pace until unemployment has stopped rising.
Terminal Velocity of Unemployment: 6 million?
See that tiny blip at the top of the long rise in the number of unemployed? That might develop into a full-blown reversal and decline in unemployment as we saw at the end of previous recessions. But be careful: we have seen a half dozen similar blips during this depression since we warned about Unemployment by industry: Recession or depression?, so we�ll have to look for other signs to confirm whether or not we are seeing a recovery this time, unlike the other six false starts. In Argentina in 2001, a similar rate of rising unemployment to 20% leading up to the crisis continued through the crisis before peaking in the middle of 2002 at 24%.
The money�s got to come from someplace to finance increased consumer spending, either from personal incomes, savings, or new borrowing. A look at personal income and debt will help us confirm whether the Fed, Congress, and governments around the world pulled the ripcord early enough and supplied big enough green parachutes to slow the economy�s descent.
The money�s got to come from someplace to finance increased consumer spending, either from personal incomes, savings, or new borrowing. A look at personal income and debt will help us confirm whether the Fed, Congress, and governments around the world pulled the ripcord early enough and supplied big enough green parachutes to slow the economy�s descent.
Terminal Velocity of Personal Income and Consumer Debt: Negative?
Change in consumer debt just turned negative for the first time on record. CMDEBT is a measure of credit demand not supply, by the way. Until we see personal incomes rise along with consumer debt, we will not chime in with the latest calls for a �bottom� in the FIRE Economy Depression.
Set-up for a Balance of Payments Crisis?
Before we get to specific parallels between recent macro-economic developments in the U.S. since mid 2008 and Argentina in 2001, two additional exhibits show the trajectory of tools that support the economic recovery we need to avoid a �Poom� type inflation crisis.
Terminal Velocity of Reserve Bank Credit: $1.2 trillion?
No sign of relief to the banking system here. Maybe the Fed is cutting Net Free or Borrowed Reserves as the banks recover?
Terminal Velocity of Net Free or Borrowed Reserves: $800 billion?
With borrowing levels by banks from the Fed reaching new highs last month it�s hard to conclude that the U.S. banking system is on the mend.
All in all, we remain, like our foreign creditors, in a period of suspension of disbelief. We all want to believe that the U.S. can come out of this economic crisis without a debt and balance of payments crisis such as Argentina suffered in 2001. No one wants that--not our creditors, not U.S. politicians, no one. But in the real world we don�t always get what we want. If certain thresholds are surpassed, feedback loops take over that are difficult if not impossible to break.
Next we look at how the current U.S. crisis might evolve into an inflationary crisis--an Argentine debt crisis with U.S. characteristics--or not, and signs to look for to indicate whether conditions are improving or worsening, and provide key indicators that help us determine where we are in the process.
Does USA 2009 = Argentina 2001? Part II: Four Crisis Indicators ($ubscription)
All the pieces necessary for a Ka-Poom inflationary crisis are in place, and several have already occurred. How can we tell if the process is following through?
We start to answer the question by restating the key event of the Argentina crisis in 2001, the loss in confidence in the repayment of debt with full-valued currency, leading to capital flight and a self-fulfilling process of devaluation and debt default. more... ($ubscription)
iTulip Select: The Investment Thesis for the Next Cycle�
__________________________________________________
To receive the iTulip Newsletter or iTulip Alerts, Join our FREE Email Mailing List
Copyright � iTulip, Inc. 1998 - 2007 All Rights Reserved
All information provided "as is" for informational purposes only, not intended for trading purposes or advice. Nothing appearing on this website should be considered a recommendation to buy or to sell any security or related financial instrument. iTulip, Inc. is not liable for any informational errors, incompleteness, or delays, or for any actions taken in reliance on information contained herein. Full Disclaimer
All in all, we remain, like our foreign creditors, in a period of suspension of disbelief. We all want to believe that the U.S. can come out of this economic crisis without a debt and balance of payments crisis such as Argentina suffered in 2001. No one wants that--not our creditors, not U.S. politicians, no one. But in the real world we don�t always get what we want. If certain thresholds are surpassed, feedback loops take over that are difficult if not impossible to break.
Next we look at how the current U.S. crisis might evolve into an inflationary crisis--an Argentine debt crisis with U.S. characteristics--or not, and signs to look for to indicate whether conditions are improving or worsening, and provide key indicators that help us determine where we are in the process.
 |
All the pieces necessary for a Ka-Poom inflationary crisis are in place, and several have already occurred. How can we tell if the process is following through?
We start to answer the question by restating the key event of the Argentina crisis in 2001, the loss in confidence in the repayment of debt with full-valued currency, leading to capital flight and a self-fulfilling process of devaluation and debt default. more... ($ubscription)
iTulip Select: The Investment Thesis for the Next Cycle�
__________________________________________________
To receive the iTulip Newsletter or iTulip Alerts, Join our FREE Email Mailing List
Copyright � iTulip, Inc. 1998 - 2007 All Rights Reserved
All information provided "as is" for informational purposes only, not intended for trading purposes or advice. Nothing appearing on this website should be considered a recommendation to buy or to sell any security or related financial instrument. iTulip, Inc. is not liable for any informational errors, incompleteness, or delays, or for any actions taken in reliance on information contained herein. Full Disclaimer


Comment