Announcement

Collapse
No announcement yet.

What All Americans Need to Do NOW!

Collapse
X
 
  • Filter
  • Time
  • Show
Clear All
new posts

  • What All Americans Need to Do NOW!

    Folks,

    I,ve been preaching from the pulpit here for quite sometime.
    Those who have listened have not only made fabulous profits but now in this age of globale credit turmoil have secured their capital and secured their families future.

    Vancouver stared sub-crime in the eye and never blinked, It stared Paulson in the eye and never blinked and sure as heck stared Shiller in the eye and never blinked.

    Folks, the US is in deep deep trouble. Your dollar is essentially worthless although most Americans are not aware of this tragedy. America went off the gold standard in the 1970's another American tragedy unfortunately lost on most Americans.

    Fortunately there is hope and there is salvation.

    Follow the rainbow to Vancouver because Vancouver is Goin Up
    Vancouver is better than Gold. All the rich of Asia are clambering to move here. They will pay any price. No Global Recession. Repeat No GLobal recession will affect Vancouver. It is destiny and cannot be stopped.

    Stop listening to the doomsayers and do something. Do the right thing for your family and put an iron fist on the tiller and navigate to peace and prosperity in Vancouver

  • #2
    Re: What All Americans Need to Do NOW!

    Catch the last evanescent froth of the greatest bubble in 21st century history!

    Roll up! Roll up! See the show! (for you ELP fans . . . )

    Comment


    • #3
      Re: What All Americans Need to Do NOW!

      Roll Vancouver up...


      Roll it higher...


      Roll it higher...


      Roll it higher...


      Now, let it drop!

      From a joke I heard in spanish.
      sigpic
      Attention: Electronics Engineer Learning Economics.

      Comment


      • #4
        Re: What All Americans Need to Do NOW!

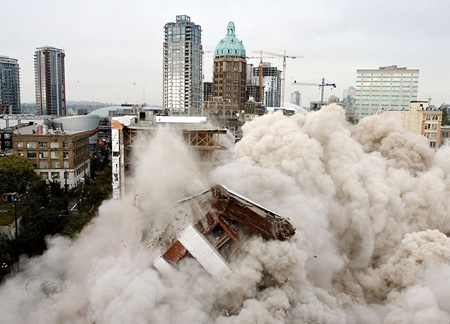
        Oops.

        Wonder what happens next?

        Comment


        • #5
          Re: What All Americans Need to Do NOW!

          Originally posted by The Province newspaper View Post
          Jameson House is one of several condo projects suspended or halted, including:
          - Onni Group's the Whittaker in New Westminster and its proposed V6A development in Vancouver's Chinatown.
          - Two Surrey residential towers, Infinity and Sky Towers.
          - Lucaya, a $30-million condo development in Kelowna, and Capella, a $1.4-billion luxury project on Vancouver Island.
          - Millennium's $400-million Evelyn towers near Park Royal mall in West Vancouver.
          - The $500-million-plus downtown Vancouver Ritz-Carlton hotel-condo project has also been put on hold.

          "There is no precedent for what's happening today," said Simpson.
          That last line from the article is disingenuous.

          The greater Vancouver metro area has seen some spectacular condo busts. The last "big one" was triggered by the handover of Hong Kong to the Chinese. Developers were selling off-plan high rise condos [some less than 600 sq ft] to Hong Kong buyers, who were apparently "buying insurance" sight unseen. As the story of limitless Asian buying interest spread, and prices kept rising, the uninformed speculators were once again drawn into the game. When the inevitable bust came there were numerous high rise condo towers in the West End of downtown that were completely dark at night. Not a single resident [or tenant].

          Comment


          • #6
            Re: What All Americans Need to Do NOW!

            Originally posted by GRG55 View Post
            That last line from the article is disingenuous.

            The greater Vancouver metro area has seen some spectacular condo busts. The last "big one" was triggered by the handover of Hong Kong to the Chinese. Developers were selling off-plan high rise condos [some less than 600 sq ft] to Hong Kong buyers, who were apparently "buying insurance" sight unseen. As the story of limitless Asian buying interest spread, and prices kept rising, the uninformed speculators were once again drawn into the game. When the inevitable bust came there were numerous high rise condo towers in the West End of downtown that were completely dark at night. Not a single resident [or tenant].
            always wanted my very own apt building... free open spaces... hold a big party.

            Comment


            • #7
              Re: What All Americans Need to Do NOW!

              Originally posted by metalman View Post
              always wanted my very own apt building... free open spaces... hold a big party.
              Haven't heard from our good friend in quite a while...the one who started this thread, and a number of others like it. :rolleyes:

              It's official. It's over in Vancouver :eek:.

              How do we know?

              One of the funniest blogs on the insanity underway in my hometown, condohype, has signed off for good. It was a scream while it lasted...

              How are we possibly going to live without the obligatory interior water feature, or the dedicated pizza oven in the oversized, but underused, kitchen? Civilization will never be the same again...

              http://condohype.wordpress.com/
              Foreclosure

              March 31, 2009 by condohype

              I spent last night reading over all the posts I’ve written. The earliest days of the blog — specifically those leading up to the market peak in Spring 2008 — are undoubtedly the best. It’s in this period where the writing’s ironic deconstruction is at its most devastating and most funny.

              Part of me longs for the days of bidding wars and double-digit appreciation. In those insane times Vancouver hit the apex of its narcissism. In our self-love, we found meaning in a condo-cultural existence. Sophisticated. Discerning. Urbane. Marketers called it “the lifestyle.” Vancouver, the city of dreams — yours to own — starting at $800 a square foot.

              After more than 24 months, 200 posts and millions in disappeared market value, Condohype is in foreclosure. This is my last post. Falling prices and a contracting economy have humbled the Vancouver real estate fantasia. The changing conditions of the market make my brand of comedy less funny. Irony is my weapon of choice and there’s no irony in watching an inflated economy collapse. It is the natural course.

              History will be mostly unkind when it looks back on the boom years. So much of a culture is summed by the advertising of the day. When researchers look back at the condo ads, what will they make of Vancouver circa 2002-2008? Probably a lot like what we make of consumer marketing of the 1950s: Silly, offensive and alien to modern values. Father knows best? Own the lifestyle?

              Despite all that’s happened, I still love Vancouver. It’s a strange love but love nonetheless. It’s like that crush you had in high school — the one that rejected you and you’re madly in love with regardless. Over the years, you may have become bitter, at times even angry, but you never give up that some day the dream will come to be. (Those who give up move to Toronto.)

              So, I guess this is the part where we say goodbye. In the interest of full disclosure, I’ll put an end to the rumour about my identity. For the record, I am not Bob Rennie.

              Thank you so much for reading. I hope you’ve had a fun time. The comments are open for final thoughts.
              Last edited by GRG55; April 12, 2009, 11:22 AM.

              Comment


              • #8
                Re: What All Americans Need to Do NOW!

                And if there was any question that Vancouver was the real estate bubble capital of Canada, have a scan down this chart of average prices one year ago, and further down the charts from 1st Q this year. Even compared to bubblicious Calgary and perpetually overpriced [and overated] Toronto, Vancouver was, and remains, insane.

                I don't imagine VancouverGoingUp would care to comment.

                Is all that rain really worth it?

                Chart courtesy of Royal LePage
                http://www.royallepage.ca/CMSTemplat...e.aspx?id=1746


                FIRST QUARTER 2008 HOUSE PRICE SURVEY DATA CHART


                Detached Bungalows


                Standard Two Storey


                Standard Condominium


                Market


                Q1 2008 Average


                Q1 2007 Average


                Bungalow % Change


                Q1 2008 Average


                Q1 2007 Average


                2 Storey % Change


                Q1 2008 Average


                Q1 2007 Average


                Condo % Change


                Halifax


                $207,333


                $190,000


                9.1%


                $246,333


                $200,000


                23.2%


                $152,000


                $144,000


                5.6%


                Charlotte-
                town


                $155,000


                $145,000


                6.9%


                $185,000


                $175,000


                5.7%


                $105,000


                $100,000


                5.0%


                Moncton


                $152,000


                $138,000


                10.1%


                $135,300


                $132,000


                2.5%


                -


                -


                Fredericton


                $160,000


                $156,000


                2.6%


                $197,000


                $187,000


                5.3%


                $126,000


                $131,000


                -3.8%


                Saint John


                $185,000


                $161,700


                14.4%


                $264,000


                $210,400


                25.5%


                $142,000


                $118,500


                19.8%


                St. John's


                $164,000


                $145,000


                13.1%


                $229,333


                $200,000


                14.7%


                $173,333


                $148,333


                16.9%


                Atlantic


                $170,556


                $155,950


                9.4%


                $209,494


                $184,067


                13.8%


                $116,389


                $106,972


                8.8%


                Montreal


                $227,799


                $219,313


                3.9%


                $332,389


                $323,375


                2.8%


                $201,778


                $197,438


                2.2%


                London


                $223,300


                $203,500


                9.7%


                $230,300


                $211,470


                8.9%


                $124,100


                $116,000


                7.0%


                Ottawa


                $311,583


                $298,083


                4.5%


                $309,833


                $294,667


                5.1%


                $198,083


                $187,333


                5.7%


                Toronto


                $432,679


                $388,921


                11.3%


                $544,150


                $503,778


                8.0%


                $298,662


                $279,442


                6.9%


                Winnipeg


                $229,125


                $191,375


                19.7%


                $242,943


                $220,714


                10.1%


                $138,000


                $122,000


                13.1%


                Regina


                $237,138


                $158,500


                49.6%


                $227,000


                $159,500


                42.3%


                $160,917


                $102,500


                57.0%


                Saskatoon


                $340,000


                $226,250


                50.3%


                $395,000


                $257,500


                53.4%


                $220,000


                $155,000


                41.9%


                Calgary


                $442,852


                $402,933


                9.9%


                $445,792


                $411,456


                8.3%


                $281,807


                $261,336


                7.8%


                Edmonton


                $330,000


                $347,000


                -4.9%


                $363,707


                $377,643


                -3.7%


                $235,000


                $254,667


                -7.7%


                Vancouver


                $852,750


                $758,000


                12.5%


                $948,750


                $837,500


                13.3%


                $455,750


                $403,500


                12.9%


                Victoria


                $439,000


                $384,500


                14.2%


                $460,000


                $418,000


                10.0%


                $294,000


                $248,000


                18.5%


                National


                $336,834


                $311,108


                8.3%


                $400,647


                $374,114


                7.1%


                $240,423


                $225,006


                6.9%


                Royal LePage’s quarterly House Price Survey shows the following annual change of prices for key housing segments in select national markets:
                Detached Bungalows

                Market

                Q1 2009 Average

                Last Quarter Average

                Q1 2008 Average

                Bungalow % Change

                Halifax

                215,667

                195,000

                185,000

                16.6%

                Charlottetown

                157,000

                157,000

                155,000

                1.3%

                Moncton

                156,000

                150,000

                152,000

                2.6%

                Fredericton

                167,000

                162,000

                160,000

                4.4%

                Saint John

                201,476

                225,064

                199,786

                0.8%

                St. John's

                193,000

                190,050

                164,000

                17.7%

                Montreal

                232,375

                235,293

                227,799

                2.0%

                Ottawa

                317,500

                321,333

                311,583

                1.9%

                Toronto

                405,286

                376,286

                432,679

                -6.3%

                Winnipeg

                231,663

                221,150

                229,125

                1.1%

                Regina

                266,625

                274,167

                237,138

                12.4%

                Saskatoon

                312,500

                300,000

                340,000

                -8.1%

                Calgary

                391,833

                410,333

                442,852

                -11.5%

                Edmonton

                298,750

                300,000

                336,250

                -11.2%

                Vancouver

                743,750

                743,750

                852,750

                -12.8%

                Victoria

                453,000

                440,000

                439,000

                3.2%

                National

                319,865

                316,717

                337,023

                -6.1


                Standard Two Storey

                Market

                Q1 2009 Average

                Last Quarter Average

                Q1 2008 Average

                2 Storey % Change

                Halifax

                242,000

                240,000

                229,000

                5.7%

                Charlottetown

                188,000

                188,000

                185,000

                1.6%

                Moncton

                134,500

                126,000

                135,300

                -0.6%

                Fredericton

                210,000

                210,000

                197,000

                6.6%

                Saint John

                268,000

                294,695

                264,000

                1.5%

                St. John's

                265,000

                261,800

                229,333

                15.6%

                Montreal

                330,056

                334,850

                332,389

                -0.7%

                Ottawa

                318,500

                320,083

                309,833

                2.8%

                Toronto

                516,052

                522,050

                545,750

                -5.4%

                Winnipeg

                251,721

                251,171

                242,943

                3.6%

                Regina

                245,000

                245,000

                227,500

                7.7%

                Saskatoon

                348,500

                348,500

                395,000

                -11.8%

                Calgary

                390,689

                417,511

                445,792

                -12.4%

                Edmonton

                326,713

                354,363

                372,738

                -12.3%

                Vancouver

                828,750

                837,500

                948,750

                -12.6%

                Victoria

                435,000

                433,000

                460,000

                -5.4%

                National

                379,636

                385,777

                401,040

                -6.5%


                Standard Condominium

                Market

                Q1 2009 Average

                Last Quarter Average

                Q1 2008 Average

                Condo % Change

                Halifax

                144,000

                144,000

                130,000

                10.8%

                Charlottetown

                120,000

                120,000

                120,000

                0.0%

                Moncton

                N/A

                N/A

                N/A

                N/A*

                Fredericton

                137,000

                133,000

                126,000

                8.7%

                Saint John

                181,387

                158,283

                153,000

                18.6%

                St. John's

                205,667

                203,000

                173,333

                18.7%

                Montreal

                206,528

                203,808

                206,556

                0.0%

                Ottawa

                207,833

                207,833

                198,083

                4.9%

                Toronto

                289,397

                296,895

                298,662

                -3.1%

                Winnipeg

                145,943

                132,643

                138,000

                5.8%

                Regina

                168,806

                172,917

                160,917

                4.9%

                Saskatoon

                187,000

                186,500

                220,000

                -15.0%

                Calgary

                245,756

                257,189

                281,807

                -12.8%

                Edmonton

                210,000

                219,031

                243,750

                -13.8%

                Vancouver

                431,500

                405,000

                455,750

                -5.3%

                Victoria

                260,000

                265,000

                294,000

                -11.6%

                National

                232,877

                233,462

                241,152

                -4.0%

                Last edited by GRG55; April 15, 2009, 11:51 AM.

                Comment


                • #9
                  Re: What All Americans Need to Do NOW!

                  Originally posted by GRG55 View Post
                  And if there was any question that Vancouver was the real estate bubble capital of Canada, have a scan down this chart of average prices one year ago, and further down the charts from 1st Q this year. Even compared to bubblicious Calgary and perpetually overpriced [and overated] Toronto, Vancouver was, and remains, insane.

                  I don't imagine VancouverGoingUp would care to comment.

                  Is all that rain really worth it?

                  Chart courtesy of Royal LePage
                  http://www.royallepage.ca/CMSTemplat...e.aspx?id=1746
                  Thanks for update on condohype. It's been a long time since I've looked at the site but it was pretty funny stuff back in the day.

                  Occasionally when someone on iTulip remains staunchly bullish on stocks or a recovery, while others argue to dissuade them, I think about VancouverGoinUp. No matter what we threw at him/her, they charged on with banners and trumpets, urging us all to buy Vancouver real estate at these "bargain" prices, because it would never, ever, ever get any cheaper.

                  Until prices in Vancouver started falling and they stopped posting...

                  I'll just throw in my chart on Vancouver benchmark prices, through March 2009.

                  Comment


                  • #10
                    Re: What All Americans Need to Do NOW!

                    Originally posted by zoog View Post
                    Thanks for update on condohype. It's been a long time since I've looked at the site but it was pretty funny stuff back in the day.

                    Occasionally when someone on iTulip remains staunchly bullish on stocks or a recovery, while others argue to dissuade them, I think about VancouverGoinUp. No matter what we threw at him/her, they charged on with banners and trumpets, urging us all to buy Vancouver real estate at these "bargain" prices, because it would never, ever, ever get any cheaper.

                    Until prices in Vancouver started falling and they stopped posting...

                    I'll just throw in my chart on Vancouver benchmark prices, through March 2009.


                    I think I see a bottom forming...:rolleyes:

                    Comment


                    • #11
                      Re: What All Americans Need to Do NOW!

                      Occasionally when someone on iTulip remains staunchly bullish on stocks or a recovery, while others argue to dissuade them, I think about VancouverGoinUp.
                      I have to admit that one of the great things about this forum is that there is a documented history of everyone's written opinions/projections that allows someone like me to judge everyone's credibility.

                      Comment

                      Working...
                      X