 Tweet
Tweet
Below is my first contribution to iTulip - it's nothing particularly brilliant, but I wanted to point out how three different analyses were pointing to the same conclusion. Below has been cross-posted at my blog, autodogmatic.com
------------------------------------------------------------------------------
All intelligent investors take note: we are currently in the midst of a long-term secular bear market in equities that will most likely last until sometime between 2010 and 2020. How do I know this for a fact? I don't. However, in the past few weeks, I've come across three separate analyses that would lead one to this conclusion. They are as follows:
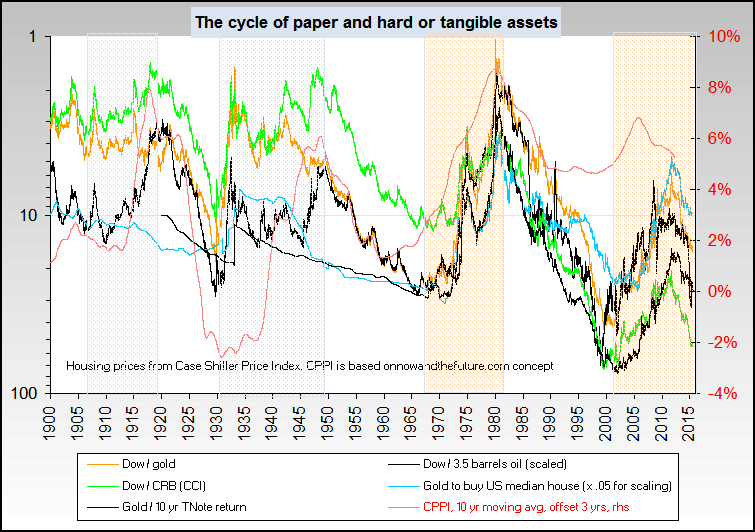
The first source was found via Jim Rogers Hot Commodities. In Rogers' book, he cites a study completed by Barry Bannister, an analyst for Legg Mason Wood Walker, Inc., that showed a negative correlation between equities and commodities. Secular equity bull markets were found to be followed by secular equity bear markets and commodity bull markets. Bannister's findings can be most readily understood by examining the graph below from Rogers' book (Click the image to enlarge):

Bannister's study showed that these alternating bull/bear cycles lasted 17 to 18 years. Note that the equity bull market peaked around 2000, which means that we are in a long-term equity bear market (And a long-term commodity bull market).
The second confirmatory source was found over on iTulip.com. It's a graph of the DJIA divided by the CPI-U, which is the broadest measure of consumer prices that the government provides. Again, a picture is worth a thousand words:

Looking at the Real Dow graph, take note that there are only two ways for the DJIA to revert to the mean: either decrease the numerator via deflation of the DJIA or increase the denominator via inflation of the CPI-U. Either way, if history is any guide, we're in for a hell of a ride because one of the two alternatives must occur.
Found via an article titled, No room to zoom? Commentary: Stocks may face a dreary decade ahead, on MarketWatch (Hat tip to Aaron Krowne's FURL), Jeremy Siegel of the Wharton School found that the real rate of return on the stock market for the past 200 years was a mere 7%. Once again, here is a graph from the article (No need to enlarge):

In the MarketWatch article, Peter Brimelow and Edwin S. Rubenstein note the following (emphasis mine):
I don't think any further comments on this article are necessary as by now, I'm pretty sure you're seeing the big picture.
What does all of this mean? Well, it could mean nothing. Simply because three different analyses happen to arrive at the same conclusion could merely be coincidence. It's also possible that the analyses are simply incorrect. That said, for my purposes, it's enough to make me think thrice before pumping my savings into equities.
Beware! The bear is at large.
If you liked this, Digg it!
------------------------------------------------------------------------------
All intelligent investors take note: we are currently in the midst of a long-term secular bear market in equities that will most likely last until sometime between 2010 and 2020. How do I know this for a fact? I don't. However, in the past few weeks, I've come across three separate analyses that would lead one to this conclusion. They are as follows:
The Bannister Study
The first source was found via Jim Rogers Hot Commodities. In Rogers' book, he cites a study completed by Barry Bannister, an analyst for Legg Mason Wood Walker, Inc., that showed a negative correlation between equities and commodities. Secular equity bull markets were found to be followed by secular equity bear markets and commodity bull markets. Bannister's findings can be most readily understood by examining the graph below from Rogers' book (Click the image to enlarge):

Bannister's study showed that these alternating bull/bear cycles lasted 17 to 18 years. Note that the equity bull market peaked around 2000, which means that we are in a long-term equity bear market (And a long-term commodity bull market).
The Real Dow
The second confirmatory source was found over on iTulip.com. It's a graph of the DJIA divided by the CPI-U, which is the broadest measure of consumer prices that the government provides. Again, a picture is worth a thousand words:

Looking at the Real Dow graph, take note that there are only two ways for the DJIA to revert to the mean: either decrease the numerator via deflation of the DJIA or increase the denominator via inflation of the CPI-U. Either way, if history is any guide, we're in for a hell of a ride because one of the two alternatives must occur.
The Siegel Study
Found via an article titled, No room to zoom? Commentary: Stocks may face a dreary decade ahead, on MarketWatch (Hat tip to Aaron Krowne's FURL), Jeremy Siegel of the Wharton School found that the real rate of return on the stock market for the past 200 years was a mere 7%. Once again, here is a graph from the article (No need to enlarge):
In the MarketWatch article, Peter Brimelow and Edwin S. Rubenstein note the following (emphasis mine):
When we first looked at Siegel's numbers in the late 1990s, stocks were over 80% above the long-run total return trendline, about as high as they ever get. Stocks reached similar levels in 1928 and 1968 -- both years when the stock market was notoriously topping out.
Stocks did fall after 2000 (remember?) But they never got lower than a few points below trend. Then the post-election Bush bounce in 2004-2005 took stocks to some 7% above trend. After that, stocks stalled. That means that this time last year, because of that relentlessly cumulating trendline, stocks were down to less than 1% above it. See Aug. 26, 2005 column.
Now it's even tighter: Stocks are just 0.1% below trend, to be exact. And even that's still well above the levels usually seen at major bear market lows. In both 1931 and 1973, stocks got some 40% below trend. In other words, an epochal but not unprecedented bull market high has not yet, unlike in every other case on record, been succeeded by a corresponding bear market low.
This may sound worrying. But of course the major market indexes we're used to watching don't literally have to fall 40%. Because the underlying total return trend rises at some 7% a year, the indexes can just move sideways. How long? Well, adjusting just for dividends, if the Dow Jones Industrial Average moved sideways until 2019, that would be the equivalent of Siegel's broad, total-return measure of stocks getting 40% below trend.
That's a 19-year stagnation in total, quite comparable to the Dow 16-year stagnation after 1966.
I don't think any further comments on this article are necessary as by now, I'm pretty sure you're seeing the big picture.
Conclusion?
What does all of this mean? Well, it could mean nothing. Simply because three different analyses happen to arrive at the same conclusion could merely be coincidence. It's also possible that the analyses are simply incorrect. That said, for my purposes, it's enough to make me think thrice before pumping my savings into equities.
Beware! The bear is at large.
If you liked this, Digg it!


Comment