 Tweet
Tweet
Hope and Fear – Part I: Year of Promise

Up, up and away or photoshopped recovery?
“It is my guiding confession that I believe the greatest error in economics is in seeing the economy as a stable, immutable structure.”
- John Kenneth Galbraith - A Journey Through Economic Time (1994)
• Fiscal stiffs
• Best laid plans
• No gold but oil
How did the doomers get 2012 so wrong? They spied the Mayan calendar and saw end-times December 21. Less credulous eyes saw the 13th Mayan Baktun, each Baktun lasting 144,000 days, ending on December 21. To the instant that end was followed by the 14th Baktun. This, the new and current Baktun that we are in, will end in another 394.3 years. Then another Baktun will start. On and on forever, as was the Mayan's philosophy of time.
Lesser doomsday scenarios also failed to materialize for the same reason: careless analysis.
The euro zone didn't disintegrate, Japan's bond marked didn't blow up, China's economy didn't melt down, oil prices didn't crash, and the U.S. economy did not collapse into a second Great Recession.
Defying expectations of doom, the benign economic events of 2012 set the stage for complacency in 2013, despite lingering post-financial crisis anxiety. Above the distant clatter of war sabers in Asia and a metastasizing Islamic extremist threat in North Africa, the comforting hum of recovery dominates the sphere.
The housing market correction that began in 2006 leveled off in 2012. Prices begin to rise as long-term unemployment finally eases. The kids move back out of Mom's and Dad's house where they took refuge after the crisis. New households begin to form again and relocate to new jobs that are at last appearing.
The debt ceiling standoff will end in a stalemate as did the fiscal cliff. The ECB will pledge more funds to prevent a liquidity crisis in the euro zone next time one arises. Barring war, China will continue to shuffle paper and fib its way to meet growth expectations.
All of these salubrious trends, taken together, may not be enough to excite the animal spirits into speculative fervor but will be enough to lull investors into the kind of complacency that can later lead to bullish optimism and all of the errors of judgment entailed.
What could possibly go wrong, outside of the unlikely event of Japanese and Chinese warships or fighter jets bumping into each other as they contest awkwardly for the Insecure Nations Sovereign Rights Defense Vigilance Prize in the East China Sea?
Not all signs point to the kind of self-sustained recovery that justifies the optimism I'm seeing today.
Retail sales were exceptionally sluggish over the holidays. Two years of recession then three years in an output gap turned American consumers into an army of bargain hunters. In no hurry to spend paychecks that are shrinking by inflation on one end and by taxes on the other, consumers are delighted to find goods on the shelves at fire sale prices as the new year begins.
In keeping with our long-term forecast, brutal competition among producers for the dwindling purchasing power of the American consumer will continue to thin the producer herd until there are only two majors left standing in each consumer segment, who by virtue of lack of competition gain pricing power, driving inflation further up and consumer purchasing power deeper down.
This promises to be a year where inflation stirs beyond food and energy prices, but not enough to gain the public notice of a Fed that has committed itself in writing to zero interest rates through 2015.
Thanks to an 11th hour compromise between the White House and the GOP to end the fiscal cliff standoff, America's $40,000 median household income will shrink by an average $1,000 as payroll tax deductions rise.
The folly of raising taxes during an output gap will be relearned in 2013 but not until the second half of the year. By then the cumulative impact of weak and declining demand in Europe and the U.S. may join with higher taxes and low productivity gains to leave the economy vulnerable to minor shocks. The stock market is on track to rally right into it, as it always does, creating a trade opportunity for the adventuresome who seek advantage over the herd.
The herd is driven by two kinds of fear: fear of losing money and fear of losing out on gains that the other guy might be making. The second kind of fear, the fear of missing out, motivates the masses to take great risks. It is commonly mistaken for greed. Greed exists but is exceedingly rare. One in a million investors is wily and courageous enough to be greedy whereas the vast populace seethes with resentment at any friend, neighbor, or random stranger who has or appears to have more than they do, no matter how hard they worked for it. The unscrupulous populist politician taps into this deep and ever-ready reservoir of resentment for votes, quick and dirty. The statesman avoids it because the genie of resentment of the strong by the weak once released is loathe to return to captivity. Ask Chairman Mao.
As the dust settles from 2012 it will be learned that quite a few investors made a lot of money in the stock market last year. This will anger enough investors who have been sitting it out since 2009 to inspire them to chase the dream in 2013. They will drive up stock prices, at least in the early part of this year, and even drive bond prices down in the bargain, fulfilling the Great Rotation wish of many a fund manager pining for a fat 2013 bonus.
It won't surprise me to see the S&P500 break through the 1550 level that's held it back for more than 12 years as the interest rate on a 10-Year UST reaches 2.5% before the stock rally ends and a recession begins. Such is the perennial disconnect between the emotions of the crowd and the reality of the crowd's real circumstances.
But none of this is of great importance in the grand scheme of things, and it is the grand scheme that has since 1998 been our mission to analyze and understand.
Unlike the harsh -7% of GDP mid-gap recession of late 1937 and early 1938, a mid-gap recession of 2013 if it happens will be short and shallow, in the area of -1% to -2%. The Fed's response, if the recession happens, will be as predictable as the response we forecast here in 2006 when we foresaw a severe, multi-year recession to start at the end of 2007. We said the Fed was going to unleash a river of money on the world and put bad loans on its balance sheet, that is, all the stupid, unprofitable bets made by the banks that the Fed was supposed to be regulating. By this expedient the Fed avoided a deflationary depression, also predicted here. Instead, we said, we'll get a grinding recovery, with wages deflating against commodity prices. And so it was.
The year 2013 is the fifth year of The Great Debt Deflation that began in 2008 and will continue until a new epoch begins, the one that we have since 2006 referred to as Period X. With each new, boil-the-ocean analysis here, Period X looks increasingly like a funhouse mirror image of The Great Credit Inflation of 1983 to 2008, but shorter and in the other direction, with interest rates rising and the growth benefits of a continuous re-financing of debt across the economy reversed.
Time is the great teacher. Four years ago in January 2008 we proposed three scenarios of a complete reversion to the mean of the Real DJIA growth rate. At the time we forecast of a 40% decline in the stock market that year. In the event the correction took the trajectory indicated below identified by the numeral 1. However, instead of a correction all the way down to the mean grow rate, reflation policy -- currency depreciation, rate cuts, and deficit spending -- stopped the correction well above the mean and reversed the correction.
iTulip DJIA as Economic Yardstick January 2008
• Economic history as reflected in the DJIA is divided into nine periods A - I and Period X when unsustainable trends
that began in 1994 revert.
• Possible futures of the DJIA as seen by iTulip in Jan. 2008 the month after we forecast a 40% decline in the DJIA for that year.
• The DJIA was forecast to revert all the way back to the 1924 to 1994 growth rate.
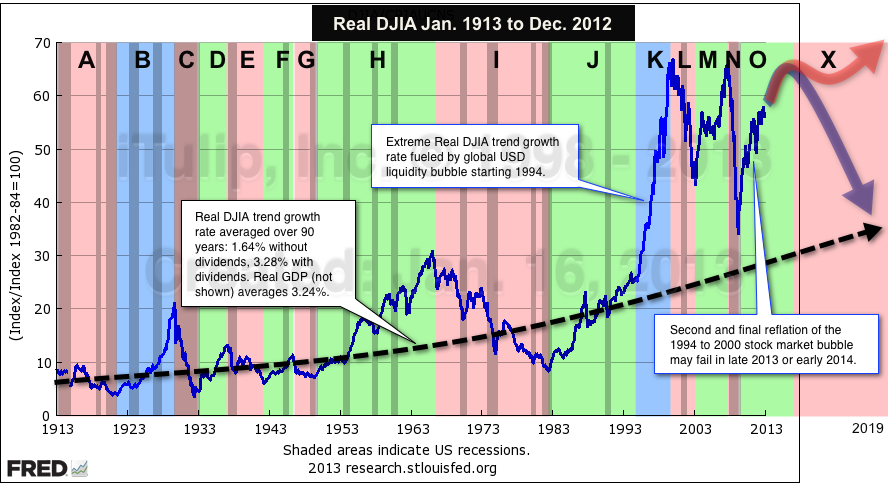
iTulip DJIA as Economic Yardstick 2013
• Economic history as reflected in the DJIA is divided into 15 periods A - O and Period X when unsustainable trends
that began in 1994 revert. Grey indicates recessions.
• The DJIA did correct 40% as forecast but not to the long-term rate.
• Possible futures of the DJIA as of Jan. 2013 are conditional: If central bank and government spending succeed in
restarting private credit growth then stocks recover to the Great Credit Inflation growth rate, else they revert to the long-term rate.
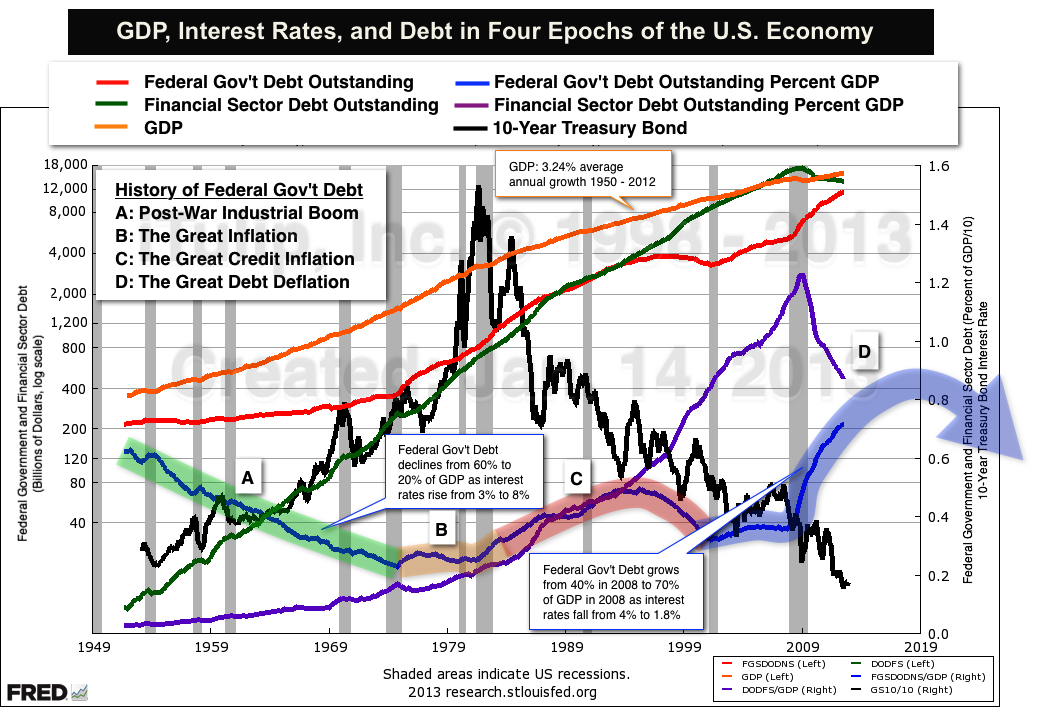
Why did the stock market take off in 1994? The answer is hidden in plain sight, in the Fed Flow of Funds data. Starting in 1994, the long-term relationship between debt outstanding in the Federal Government Sector of Non-Financial Sectors and Domestic Financial Sectors ended. From the 1953 until 1994, the two netted to close to zero. Starting in 1994, Financial Sectors Debt Outstanding started to take off, peaking at $11 trillion in excess of Federal Government Debt in 2008. It's been declining ever since. As it has, the output gap created by the last recession remains stuck open at 6% of GDP.
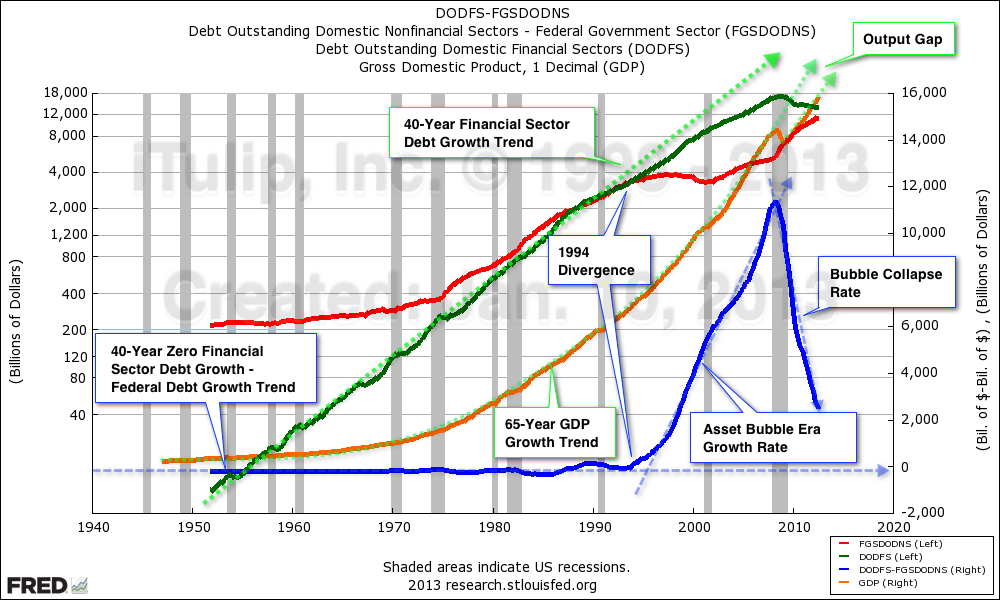
Financial Sector Debt Outstanding (DODFS, green line, log scale left). Federal Government Debt Outstanding (FGSDODNS, red line, log scale left).
Federal Government Debt Outstanding minus Financial Sector Debt Outstanding (FGSDODNS - DODFS, blue line, linear scale right).
GDP (GDP, orange line, linear scale right)
The chart above frames the first half of the existential challenge facing our economy: if not for a huge increase in government spending to compensate for the decline in private sector credit, the economy will fall back into recession. A similar situation has confronted Japan since 1994.
The credit bubble left the economy dependent on deficit spending. The deficits are structural but Congress and the White House treat them as secular, ignoring the $11 trillion in excessive credit growth that bloated the economy to its current size. Expectations are embedded in Real Potential Output. The delta of reality and potential is the Output Gap.
This circumstance is not understood even by the Fed. I asked #2 in command there directly last November and got an answer as vague and indicative of cluelessness as answers I received from Larry Summers and others who are generally considered among the elite who develop policy.
But the problem is understood by at least some members of Congress, one of whom is including some of my analysis in his book coming out later this year. There's hope for us, except for the second half of our economy's existential challenge that no one in power is eager to discuss as a public policy issue: Peak Cheap Oil (PCO).
Feeding this year's bullish attitude is the discovery that if you spend enough money, you can get heaps of oil out of the ground right here in the USA.
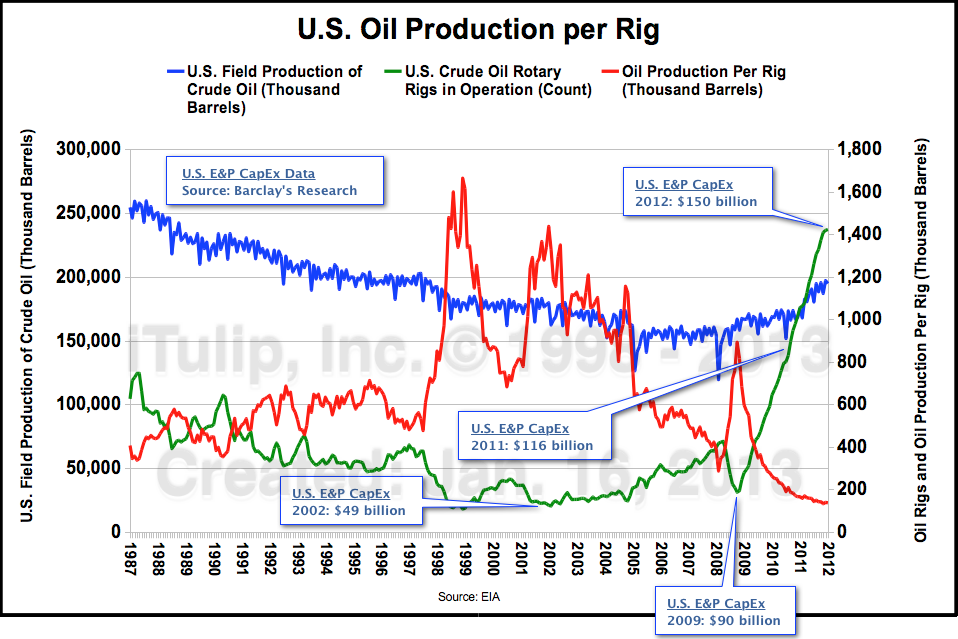
The excitement in the media in the opening weeks of 2013 over a major increase in domestic oil production since 2008 needs to be tempered by the reality of the cost of that production. The trend in production per rig that began with the onset of PCO in 1998 accelerated with the cumulative investment of $450 billion since 2008 needed to get that oil flowing. As we see in Part II, the resulting favorable impact on the balance of trade showed up in the gold price in 2012. As long as oil keeps getting more expensive the U.S. will be able to increase domestic production. Leave it to the oil industry flacks over at the Energy Information Administration to spin this as good news, as if a rising tax on the economy imposed by higher oil prices is going to help get the economy moving.
The gold market caught on to these dual existential challenges in 2001. So did we, buying the stuff on the theory that structural deficits produced by asset-bubble dependence cannot end any other way but in competitive currency depreciation, of which gold is the best currency as it is the least printable.
Our methods of analysis have evolved and improved since then. Today we know that a forecast of the mean reversion in the price of any asset class, such as stocks and bonds, is complicated by the agressive involvement of government and central banks, both indirectly by spending into the economy and depreciating the currency via liquidity operations, and directly in asset markets themselves via bond purchases ala QE1, QE2, and QE3. The size of government and central bank balance sheets is underestimated by pessimists and over-estimated by optimists. Our view is that these methods will work until they don't. The name of the game is determining the thresholds and triggers in extremis. In the long run we think the pessimists will be proved right, and the reconciliation between the reality of markets and the fantasies of academic government bureaucrats will occur in what we call Period X. In the mean time there's money to be made.
The doomers had it wrong on the Mayan calendar but maybe the Mayans had the right idea about time itself. There's wisdom in a calendar that looks out beyond the next 12 months, decades off into the future. A year is too short a slug of time to gauge the deeds of men, good or bad, and their institutions, well conceived or not. Twelve months is entirely too arbitrary as a timeframe for gauging the convoluted processes of change in the political economy that we have followed here on iTulip since 1998, changes that began well before we started and will go on long after we're gone. The mission here is to understand our world from without, to abstract ourselves and look down upon our earth as curious and disinterested aliens might, yet at the same time remain cognizant of our purpose, to continue to build on the understanding we have developed here over the past 14 years, to truly know where we stand in our time and in this place and take the best advantage we can of that knowledge.
Within the Mayan calendar's 394.4 year Baktun are 20 periods of 19.7 years called Katun. One Katun from November 1998 when this site's investigations started ends in 2019. That year may be a year worth planning for, as by that time major trends are destined to reach an inevitable conclusion one way or another. Maybe there's something to the Mayan calendar after all.
Eric Janszen
President, iTulip.com
January 19, 2013
(Editor: iTulip gratefully acknowledges the contributions of multiple Community Interviewers who contributed to this article via Ask EJ and other subscriber posts since November 2012, and here in this article.)
Fiscal Stiffs
CI: Can the battle between the White House and Congress over the ceiling cause a Petite Default? Is there a trade in there? (Hat tip to member XPat for asking the original question.)
EJ: As I explained in my previous article, the risks posed by a default, no matter how small, are serious. For that reason it will be avoided.
CI: Talk about the risk, if it did happen.
EJ: As the world's largest economy that issues the world's primary reserve currency the U.S. can get away with foolish behavior that would wreck any other country's currency and trade status. Crashing the world economy with a collapsed securitized debt bubble, for example. But failing to make each and every Treasury debt payment on time and in full is the one mistake we don't get to make.
Depending on the size of the default, that is, how large the payments are that are missed, yields will rise across the yield curve and will not recover -- ever. That "default spread" will get imbedded in the UST yield curve for decades. Creditors are unforgiving of debtors who fail to make payments. That's the way it works.
You are asking, What if the impossible happened?
That depends on: 1) How big is the default exposure, and 2) What can the administration do to mitigate it?
Here's the situation as of Monday, Jan. 14, 2013.
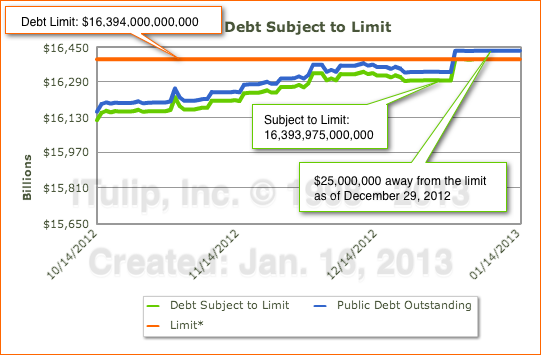
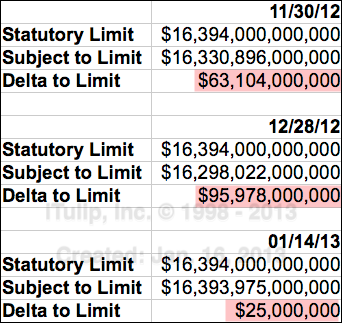
As of Monday when Treasury last released public debt data the debt subject to the statutory debt limit was a mere $25 million away from or 0.00015% of the limit. Those levels have remained there since Dec. 28, 2012 when the public debt subject to the limit was $95,978,000,000 or a relatively cushy 0.58% away from the limit.
Extrapolating we can guess that by the end of January the U.S. Treasury will be in the neighborhood of $100,000,000 over the limit if it isn't raised.
As predictable as this trend looks toward a February 2013 doomsday scenario, there are three factors worth noting for anyone who is thinking about a trade around a potential Petite Default.
One is that the limit to debt gap closed by $32,874,000,000 from November to December last year. If you look at the complete history there is significant seasonal and other variability. The gap may be less than $100 billion, but it doesn't need to be that large to wreck havoc on the yield curve if in fact payments are defaulted on. The gap is unlikely to be less than $30,000,000,000 given long-term trends.
Two, we have to assume that the administration and Congress are not as stupid as they look. It is a near certainty that a Plan B exists such as moving funds among accounts to pay down debt ahead of schedule, and buy time.
Three, neither the fiscal cliff follies nor the debt ceiling standoff had any noticeable impact on bond yields. The long end has been creeping up since July.

As in the case of the Fiscal Cliff power struggle, I think Congress is again underestimating how strong a hand the White House has to play.
I think they'll either avoid hitting the debt ceiling by raising the limit in time or if the deadline isn't met they will shuffle the bills around to make debt payments but not other payments until they work out a deal.
Fitch reported earlier this week that it may downgrade U.S. debt if the Treasury defers payments to debt versus paying other bills. As if anyone cared anymore what Fitch has to say about credit ratings. If that's the best card that the other side has to play against the White House, this will all be over soon. (This was written a week before the GOP offer appeared on Jan. 18, 2013).
Which is not to say the whole debt ceiling affair isn't upsetting and unsettling. One of our members think365 put it best: "The problem is that the fiscal appropriation and budgeting process is disconnected from the debt ceiling debate. No private corporation could get away with such irresponsible fiscal management. It would be like the board of directors and its management approving an annual cap-ex/expense budget for the coming year and entering into binding vendor contracts before you have checked with your bank(s) to make sure your line of credit can be increased to cover your budget. No competent CFO in the private sector would allow such irresponsible "cart-before-the-horse" financial mismanagement which would immediately trigger bank loan covenant violations and very likely affect (negatively) the company's credit rating."
He then quoted the U.S. Government Accountability Office expressing it this way:
"The debt limit does not restrict Congress’s ability to enact spending and revenue legislation that affects the level of debt or otherwise constrains fiscal policy; it restricts Treasury’s authority to borrow to finance the decisions already enacted by Congress and the President. Congress also usually votes on increasing the debt limit after fiscal policy decisions affecting federal borrowing have begun to take effect. This approach to raising the debt limit does not facilitate debate over specific tax or spending proposals and their effect on debt. In February 2011, GAO reported, and continues to believe, that Congress should consider ways to better link decisions about the debt limit with decisions about spending and revenue to avoid potential disruptions to the Treasury market and to help inform the fiscal policy debate in a timely way." - GOA Highlights Newsletter (July 2012).
Our comment is visual:
And it's not going to get better.
Fed Follies
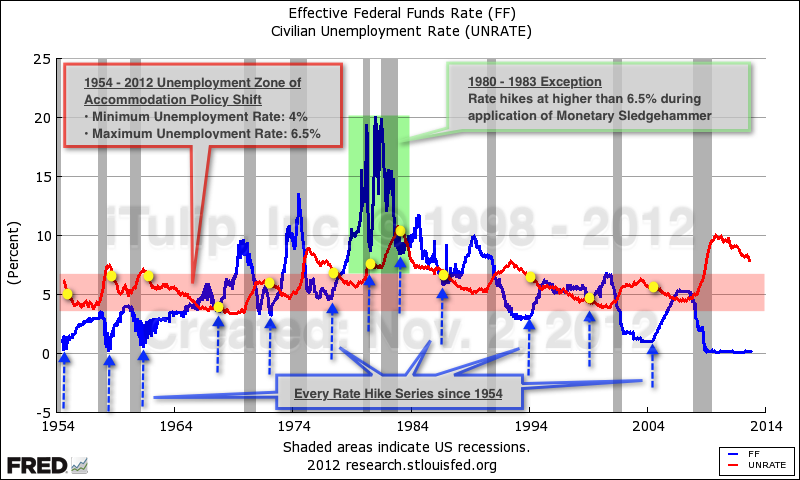
CI: The Fed recently announced that it had no intention of raising interest rates until unemployment fell to 6.5% or lower. Were you surprised by thus explicit target? Is this a throwback to using the output gap and employment to determine rate policy?
EJ: A 6.5% unemployment rate has been implicit Fed policy since the 1950s. The chart below is from my previous article, posted November 2, 2012. It notes that the accommodation threshold rate of unemployment is 6.5%. The Fed never raises interest rates if unemployment is above 6.5% and it's not going to start now.
If you want to know where the Fed's head is at on policy timing, get a load of the latest NAIRU or Natural Inflation Rate of Unemployment projections.
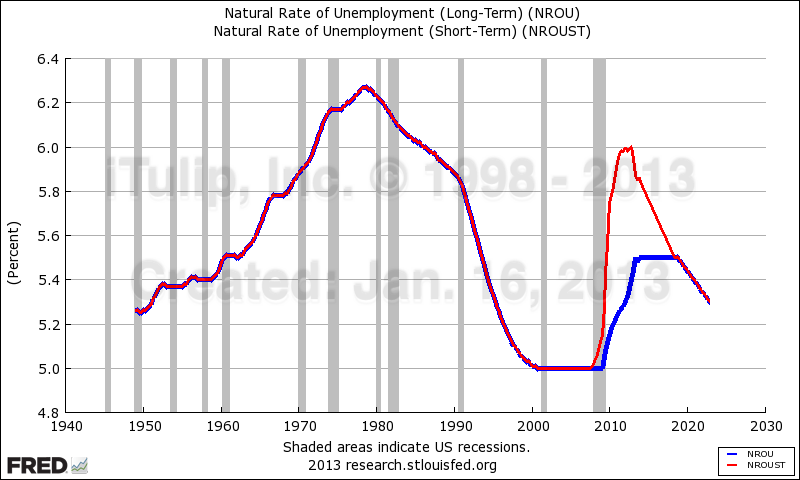
If you are wondering how they arrived at 6% for long-term NAIRU we fit Mean Duration of Unemployment on the right hand scale and add a dashed green arrow to indicate the Fed's implied projection for a decline in Mean Duration of Unemployment.
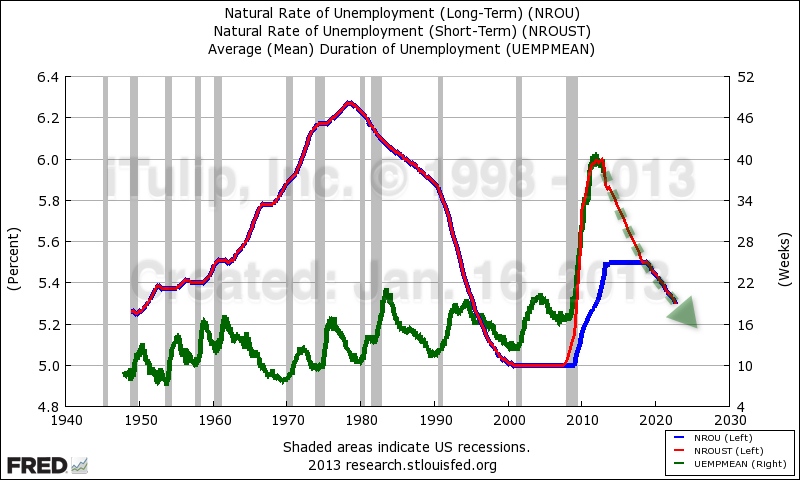
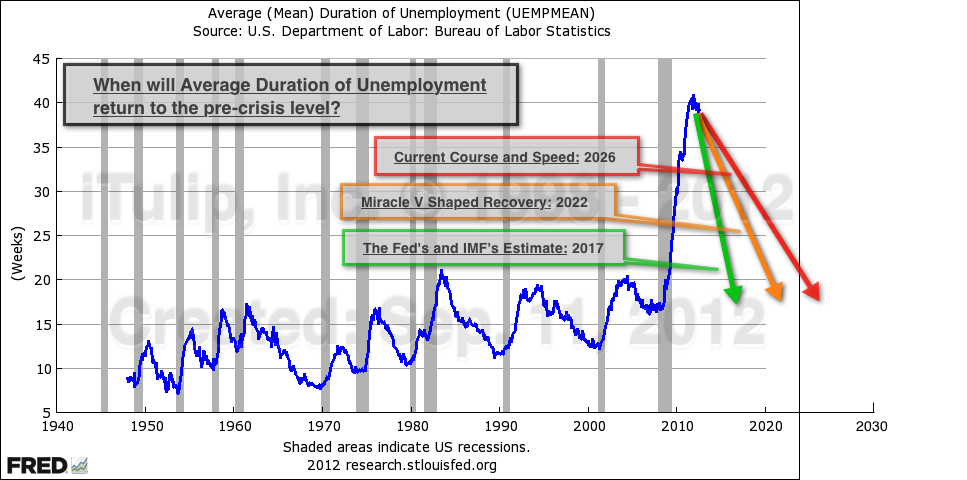
The Fed expects a return to a healthy, pre-crisis level by, say, the year 2022. Eagle eyed readers will recall a similar projection made by us last September based on other Fed and also IMF data.
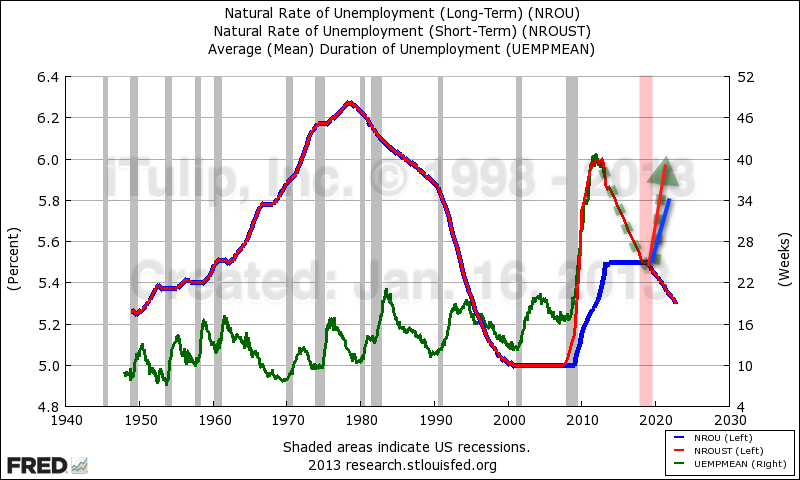
I don't think any of these projections will come to pass. The NAIRU-based projection for a return to pre-crisis unemployment by 2022 assumes that the U.S. economy will grow continuously without another recession for 13 years from 2009. The longest stretch of recession-free growth that the U.S. has experienced was between 1990 and 2001, and as I've argued that boom was considerably extended by a stock market bubble. In the unlikely event that the next recession can be put off until 2018, NAIRU will make a U-turn as Median Duration of Unemployment rises anew.
With interest rates already at zero the Fed will have few options for monetary stimulus, leaving fiscal stimulus to the work of cushioning the blow to the economy. Along with rising unemployment comes rising budget deficits as tax revenues fall and outlays to cover unemployment insurance, food stamps, and other social supports expands.
This has always been my beef with the Fed for allowing the stock and housing bubbles to occur in the first place. The Fed's deflation fighting papers laid out a clear plan for dealing with the immediate crisis but they didn't think through the long-term implications. Once an economy is this damaged it effectively needs a complete reset to get it back on track again. The U.S. economy got a reset in the form of WWII last time it got stuck in an output gap this way. It's not at all obvious how we're going to get out of it this time.
Nexus of Confusion
CI: Back to the long view. How does 2013 fit into the vision you have of the economy after running this site for 14 years?
EJ: The first thing to keep in mind is that stability is an illusion. Every crisis is followed by a recovery when the seeds of the next crisis are planted. The name of the game is to dodge the crises and play the recoveries. That in a nutshell is the art of life applied to investing in our time.
CI: Easier said than done. Rate yourself.
EJ: With respect to identifying and profiting from crises since 1998, I’ll give myself an A. We dodged and profited from two major crises since going into operation, in 2000 and 2007. We played stocks right up to the spring of 2000 and again into the winter of 2007. But I can’t give myself better than a C for taking best advantage of the recoveries that followed, particularly the post tech bubble recovery. Yes, we bought bonds at an intermediate bottom in 2000 and gold at the structural bottom in 2001, and, yes, holding those produced the best risk-adjusted return when benchmarked against a standard portfolio of stocks and bonds, but we could have done better. We're always learning.
CI: What are you doing to improve on that?
EJ: I'll describe it as a change in philosophy. Remember, we didn't buy gold in 2001 to make money. We bought gold to hedge the effects of a transition of the international monetary system from dollar-centric to multi-lateral, at first slowly as has occurred since 1999 then suddenly ala the Janszen Scenario if and when global investor sentiment shifts suddenly against the dollar. As our long-term Treasury bonds have matured, those that we haven’t rolled over into short-term bonds are being invested in private equity, that is, in start-ups and funds that are consistent with the investment thesis we have developed here over the past 14 years. The private equity investments we’ve made since early 2009 are both an effort to reduce direct exposure to bond duration and to take full advantage of this recovery while it lasts, before the next crisis.
CI: Do you think the next crisis will be the final blow-up, the Big One that caps the 30+plus year USD credit bubble?
EJ: The latest analysis puts that eventuality further off into the future, out to, say, around 2019. We've shifted Period X further off.
CI: Period X in your 2008 writings starts in 2009. Now you're saying it's around 2012?
EJ: In 2011 I thought it might start in the 2012 - 2013 timeframe. You may recall this flow diagram from January 2011.
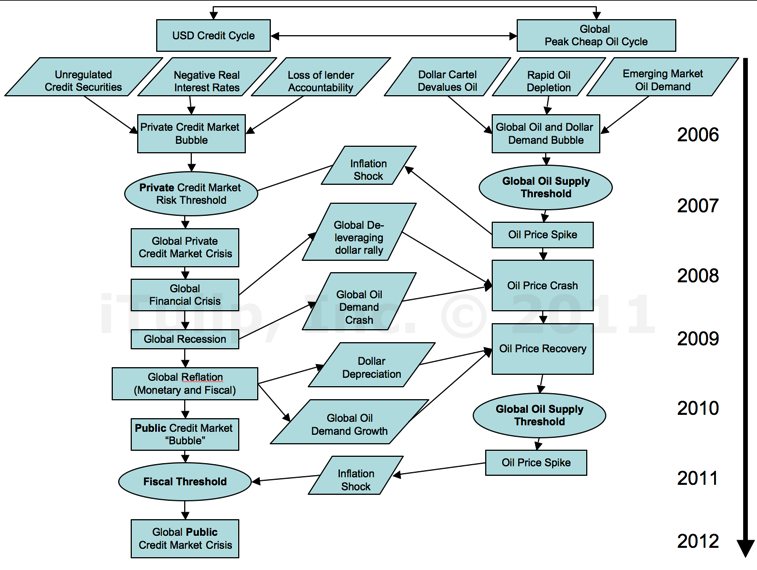
Peak Cheap Credit + Peak Cheep Oil = Public Credit Market Crisis
With minor improvements this is still the crisis process as we see it, the collision of Peak Cheap Oil and The Great Debt Deflation, but it's going to take longer than we originally though. We took a different approach that I think gets us closer to an understanding of how long the system such as it is can persist, that is, how long we have to make hay while the sun shines.
CI: If you see a Big One in a Period X off in the distance why invest in risky start-ups and funds?
EJ: We started our diversification out of long duration bonds and into funds and start-ups in June 2009. For example, Eastham Capital Fund II was a bet on rising rents and cap rates in 2010. It is producing returns well above expectations, judging by the response of iTulip folks who were recently polled: 100% said they were highly satisfied with it. Making these investments may appear contradictory on the surface but we have the downside risk of Period X covered with gold and short-term UST. Perversely, these hedge positions have produced far better risk-adjusted returns than stocks over the period. But with UST earning virtually nothing and with little room left for yields to fall and prices to rise, the only logical place to put capital to work is with entrepreneurs. They are the one asset class that we trust the most. The problem is that entrepreneurs are not a scalable asset class; there are only so many men and women who have what it takes to build and run a business, especially in this environment. If I hadn't spent 30 years in the high tech industry and 15 years involved in due diligence of technology companies I would not attempt it, and still I'll make plenty of mistakes.
CI: How does this philosophy apply to fund investing?
EJ: We don't just invest in any funds we invest in funds run by people who run funds the way entrepreneurs run a start-up. These are focused, independent people with skin in the game.
CI: What if Period X comes early?
EJ: Could a major crisis occur before we get liquidity from these funds? Of course, but again the lesson of the past 14 years running iTulip is that sitting out recoveries is expensive, and we don't invest any more in these businesses and funds than we can afford to lose. Recall that the much of the funds for our Treasury and gold purchases made in 2000 and 2001 respectively came from start-up investments that saw liquidity in 1999 and 2000. This recovery is of course nothing like the 2002 to 2007 recovery that was driven by a mortgage securities bubble, but that doesn't mean there are not investment opportunities for the diligent to be made while the sun shines.
CI: While it lasts. Might we get a head-fake minor crisis before The Big One?
EJ: I'll rephrase the question as, Will the next crisis be the big one that finally caps The Great Deflation with a surge of inflation to deflate the debt left over from The Great Credit Inflation against commodity prices and wages? To arrive at that question you first have to investigate and think through the process of economic development via a crisis and recovery that led up to this point. Over the past century there have been small crisis-recovery periods embedded within large ones, for example the decade of stock and housing bubbles embedded within a 25-year national credit bubble and international USD liquidity bubble. The recovery since 2009 is fundamentally different from any since March 2000 when we marked the top of the stock market bubble here. We launched iTulip.com four years into the 1994 to 2008 rapid expansion phase of The Great Credit Inflation that began in 1983, after The Great Inflation of the 1970s ended. That expansion spun off an equity bubble from 1994 until 2000. We arrived for the final two years of it when the hysteria phase of the tech bubble was in full swing. A mortgage credit bubble followed from 2002 to 2006. The whole 25-year shebang that I call The Great Credit Inflation ended in 2008. We have been in The Great Debt Deflation era ever since. I have a theory that I argue in Part II about how long it may last and why. It’s important to not get caught up in the present or the recent past but to take a longer view and to avoid making careless analogies between one period and another in history.
CI: Do you miss the bubble days when you first started iTulip?
EJ: Of course. Riding it up was exhilarating and selling at the top was fun, but the 12 year ride down since has fairly sucked, despite the fact that I expected it, as readers who've been with us throughout full well know. But it's not the ride down from the bubble top that worries me. Life is certainly harder today than it was for most people a dozen years ago, but things are not that bad. If you look at the data one interpretation is, Okay, so we're about where we would have been if we hadn't had the stocks and housing parties. We've taken our lumps but the worst is over. From now on it's going to be like it was in the early 1990s before the bubbles inflated the economy, with moderate growth not juiced up with asset price inflation. That's an optimistic view and I think one that represents the consensus today.
CI: Do you agree?
EJ: Every interpretation is worth investigating. Take housing, for example. One interpretation of the data is that housing price declines are finally leveling off. From here they may begin to rise to the trend growth rate that was established from 1975 until 1995 when housing prices diverged from trend. We use the FHFA's National All-Transactions House Price index and the Case-Shiller National Composite Home Price Index together, both indexed to 1990.
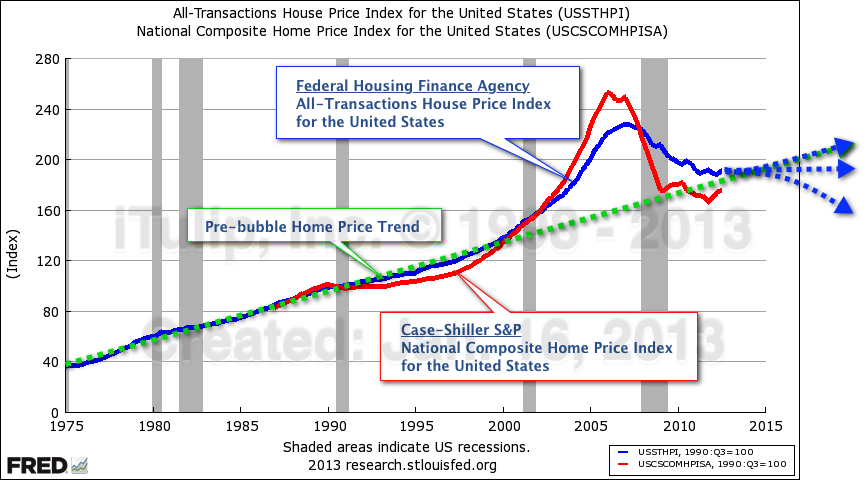
Reversion to the mean, yes, but will a government-backed secondary mortgage market and Fed-subsidized
mortgage interest rates continue to deliver a full regression and sustained recovery?
An optimist looks at this and says it's time to jump back into housing, but government subsidies of the housing market have played a major role in creating what appears to be a typical reversion to the mean from a price bubble. In particular, Fed purchases of mortgage securities and two government owned and run banks, Fannie Mae and Freddie Mac, buy 90% of the mortgages originated by private lenders. You have to ask, Can the federal government's and the Fed's balance sheet sustain these subsidies until the housing market can stand on its own? What will happen if they can't? Even if they do and we return to 1975 to 1994 home price growth rates, these never exceeded inflation over the period, so does that make housing an investment or a place to live that is hedged against inflation? This line of thinking holds true for equity and bond market data as well. Until government supports are completely withdrawn there's no way to know what the market price of any asset is. What is the mean growth rate for a market that is dependent on government finance? How can prices revert to those means as long as government finance is extant?
CI: Does this apply to stocks? Your real DJIA chart above suggests a huge correction in the future.
EJ: There's another way to look at it that's worth thinking about. Call it the One Think After Another model. As an alternative to our Real DJIA chart at the beginning of this article, consider the chart of the Wilshire U.S. Large-Cap index on a log scale below. A log scale does not adjust for inflation but it does smooth long-term asset price inflation variability. Twelve years after the stock market bubble peaked, stocks appear to be back on a healthy long-term trend from which they diverged in 1994. The second chart, using real estate security prices as a proxy for the housing market, shows how the stock market bubble collapse melded neatly into the rising housing bubble, propelled by low interest rates, unregulated MBS issuance, and unregulated home mortgage lending. The reflation from the collapse of the housing bubble via broad-based bond price fixing, asset price inflation via QE, has in turn produced a bubble in high risk debt, aka junk bonds.
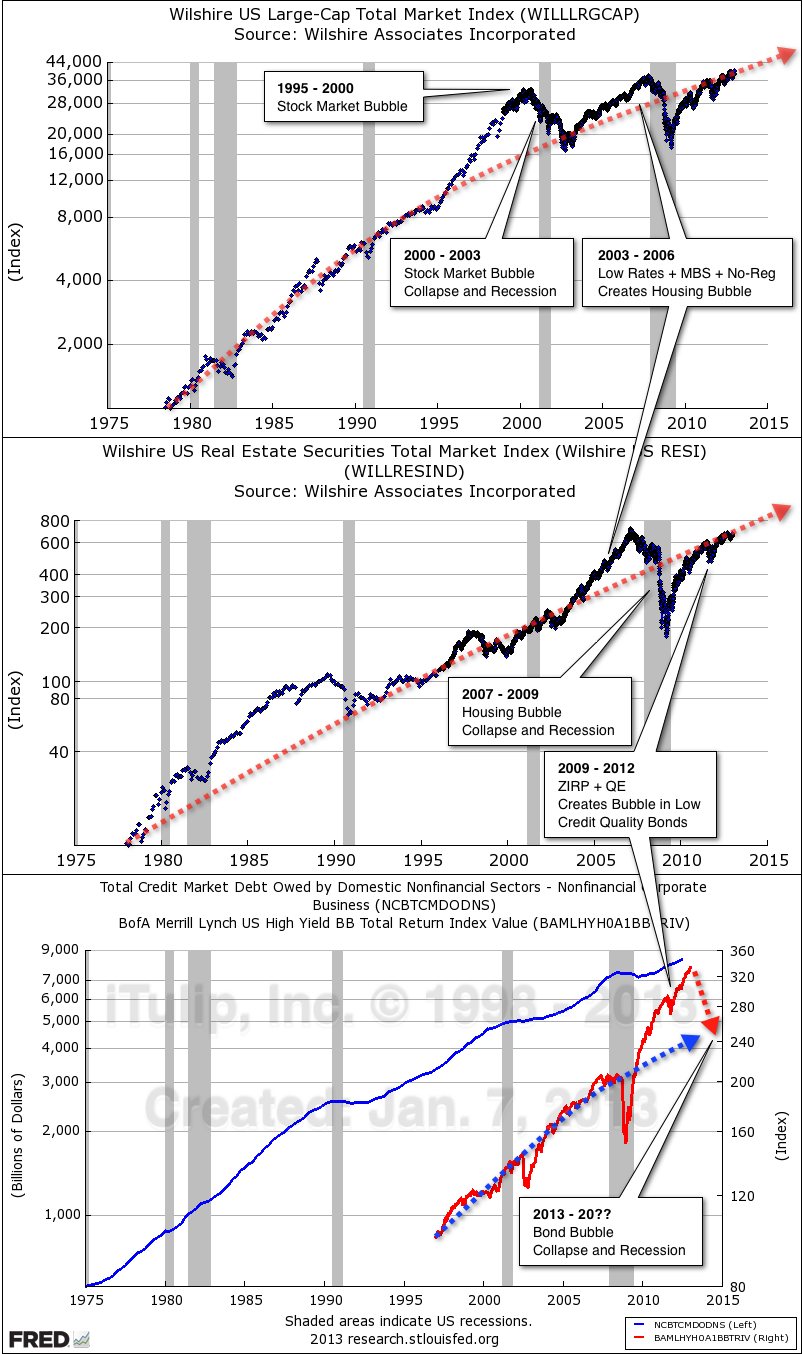
One bubble leads to another.
Stimulus measures taken to produce the recovery since 2009 has produced a bubble in low quality, high yield debt starting around 2010. That bubble will pop some day and cause yet more havoc. Government keeps trying to use the Fed's and government's balance sheet to fix the damage caused by the previous administration's use of the Fed's and government's balance sheet. So one view is that this goes on and on and never ends. My view is that each crash and reflation process causes default and inflation risk to accumulate in the UST market, under the surface. As I've been saying since 1998, this can go on for quite a while but will end when the Fed's and federal government's balance sheets are exhausted. The gold price reflects the eventual venting of sovereign debt risk via the currency. We'll talk about gold at length in Part II. But again, there are more games to be played to push out the day of reckoning. Central government credit risk can be re-distributed among the states, the U.S. can lower currency risk due to trade imbalances by producing more domestic oil, and so on.
CI: You're saying your concern is not that this is a post-bubble New Normal that the U.S. economy has reverted to after the stock market and housing bubbles. There's more reverting to go?
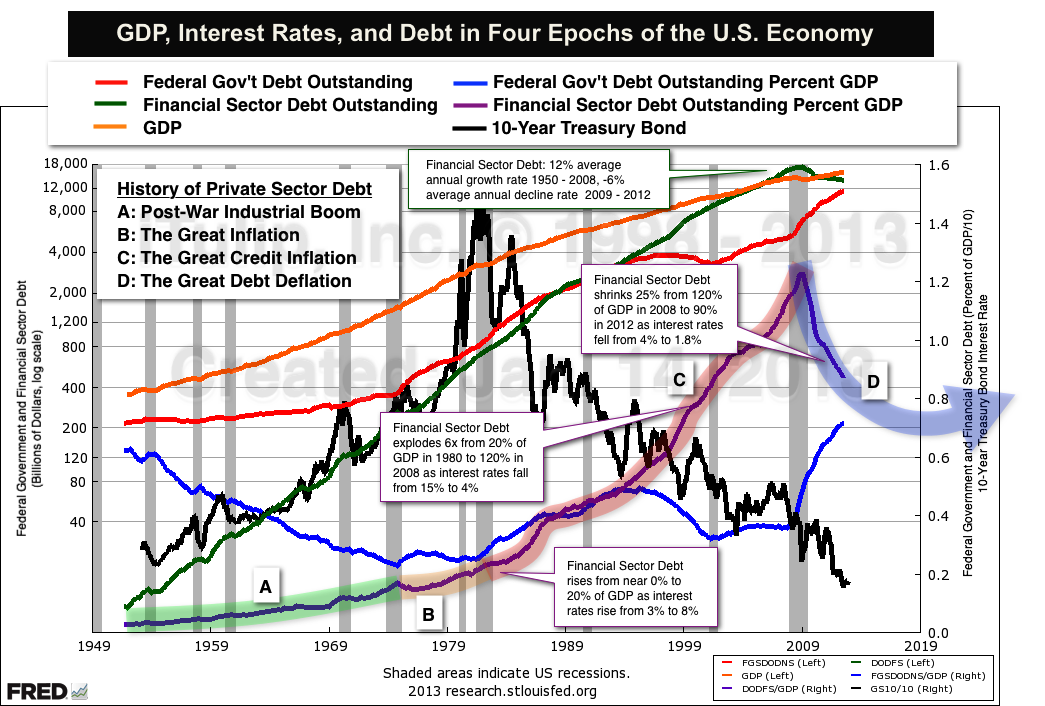
EJ: We witnessed, or lived through, or were privileged to enjoy, arguably the most expansive social and economic period in human history, from roughly 1983 to 2008. The Soviet Union disintegrated, global financial markets were liberalized and freed from state control, inflation was tamed in all major economies and most peripheral ones as well, global credit markets bloomed, money poured into the U.S., cheap oil flowed, and wars were relatively small and contained. Rapid technological innovation in everything from energy to communications was both a big assist to this transformation and a result of it. But the seeds of the undoing of this expansion were planted along the way. The most outstanding and irreconcilable of these resulted from the perpetual private sector credit expansion that fueled the expansion as interest rates fell: debt. Private sector debt peaked around 120% of GDP in 2008 and has fallen to 90% since. This has never happened before.
Referring to the chart below, Financial Sector Debt Outstanding per the latest Fed Flow of Funds (green line, left hand scale) is shown on a natural log scale over 60 years. It is also shown as a percent of GDP (purple line, right hand scale). Looking at this chart we ask, Is it possible that The Great Debt Deflation will not run to completion and turn out to be no more than a massive speed bump on the road to private sector debt in excess of 150% or 200% of GDP. I don’t see it. I don't see how the debt-to-GDP growth trend ever returns to the rate of the previous 25 years of The Great Credit Inflation era. The Flow of Funds data are clear enough. As I said back in 2008, the U.S. has only so long to get the private credit growth restarted before the U.S. government runs out of credit trying to keep the economy expanding via QE and government spending. GDP growth, such as it is, is highly dependent on deficit spending, to keep the money supply expanding by spending into the financial markets as well as into the economy itself.
CI: But Congress is obsessed with cutting the deficit, the Dems by raising taxes and the GOP with spending cuts. Is either wise while private sector debt is shrinking for years on end for the first time ever?
EJ: It's a symptom of the political response to the fact that the economic pie that credit made bigger for decades has been shrinking, and it is remarkably similar to the late 1930s when a Democrat dominated Congress voted to cut spending to reduce the deficit. Again, it's a classic case of one party becoming the agents of the opposition. In this case the Democrats are positioning for the next legislative election by reducing the deficit and cut off the opposition's future access to accusations of loose spending in the campaign. The rich will continue to be the primary political target for re-allocation of the pie as it shrinks during The Great Debt Deflation. Since 2008 when The Great Debt Deflation leaves one set of animosities behind as the economic high tides of the stock market and housing bubbles recede and an even larger collection of nasty political consequences as the legacy of The Great Credit Inflation, going all the way back to the early 1980s, becomes clearer to the populace. The long credit boom created a powerful rentier class that used wealth to gain economic advantage through the electoral system. Tax and regulatory legislation concentrated wealth and power further. Hardly anyone complained or even noticed when private credit expansion kept the pie growing but now that it’s shrinking we see the fallout is class warfare politics, the 1% versus the 99% and all that stuff.
CI: You warned about this as early as 2005 when you were writing for Always On. You said to expect social fragmentation along age, income, wealth, and race lines.
EJ: And as it turns out guns versus no guns, which is really a North versus South issue, adding that to the toxic political mix. Here in Massachusetts our populist governor plans to cut sales taxes and raise income taxes on high income earners. It's the kind of progressive tax policy that you see in societies where opportunities for the middle class to advance are evaporating, usually due to corruption and government mismanagement. The result of these policies is of course to cause opportunities to advance to become even fewer. One of our members GRG55 put it best when he said, and I'm paraphrasing, if government wants people to use less gasoline it taxes gasoline more, and if it wants them to smoke less it taxes cigarettes more, and if it wants people to work less it taxes incomes more. Works every time. On an international scale we have localized conflicts morphing into regional wars and the rise of totalitarian capitalist regimes like China that are set to take the other side in these conflicts as well as externalize domestic political challenges by playing on popular anti-Japanese sentiment.
CI: You started iTulip.com near the apex of the stock market bubble. Has the economy developed the way you expected since then?
EJ: Not at all. Yes, I expected the NASDAQ to fall 80% then stay 50% below peak for a decade, for the Venture Capital industry to underperform for a decade as liquidity events became fewer and smaller, and for the core of the tech sector to contract, that is, the part that creates the platform companies like Intel, Microsoft, and Apple. But again in the broader sweep of history, the tech stock and housing bubbles of the bubble era were only meaningful to us because they were the most dramatic events, at least to date, to happen to us as adults with an interest in and understanding of the economy and markets. Was the bubble era more dramatic than The Great Inflation of the 1970s or the FIRE Economy era of falling inflation, plunging interest rates and exploding debt and deficits that followed? Not really. I think the resolution of The Great Debt Deflation will be the defining era for the generation that came of age during the 1980s when the long credit-fueled booms started.
CI: Those of us born in the 1980s it’s like the economy boomed all our lives until 2001. After that it feels like the economy has been on one form of life support or another.
EJ: There’s never a dull moment, never a period of time when the economy is not heading into a crisis, going through a crisis, or recovering from a crisis. Every recovery is simultaneously a period of improvement and build up to the next crisis. It has always been so. The Great Inflation of the 1970s followed the 1950s and 1960s post-war boom. The U.S. started that era as the world’s dominant manufacturing and export power but ended it with a shrinking trade balance as the rest of the world caught up and U.S. politicians got the idea that the nation had an infinite pool of taxable incomes to spend on a global policing role and social welfare projects. But it’s forgotten that immediately after WWII the U.S. economy faced a major inflationary crisis as the war economy transitioned to a consumer economy. A consumer demand shock slamming into production rigidities. You could say the wartime boom planted the seeds of that crisis. That high employment boom of the war economy era had a flip side, labor shortages and high inflation despite wage controls. As the consumer economy became a war economy in the early 1940s, personal consumption expenditures fell from 80% of GDP to 50% as production shifted to war output. The privations of The Great Depression, and the Great Depression set the stage for a world war between states based on totalitarian and democratic political systems. That depression followed the excesses of a credit boom that followed a post-WWI recession, and on and on since the nation’s founding. It never stops. The challenge is in figuring out where you are in and how to play it. The special challenge of today is that the U.S. economy has been running at stall speed for years after clawing its way out of hell in Q2 2009. It won’t take much to push it into a recession. Weak holiday spending and other measures we’ll get into tell me the economy will drift slowly into recession this year.
What credit giveth, debt deflation taketh away. Private sector debt will continue to decline until it reaches 2% to 4% of GDP then rise as
interest rates rise.
Public sector debt will continue to rise until it reaches 8% to 9% of GDP then decline as interest rates rise.
CI: Why has federal government debt become the reciprocal of private debt?
EJ: As private debts are shifted to public account via government spending into the economy and the financial sector, Federal Government debt rises to compensate for declines in private sector debt. If it didn’t then the money supply would shrink. Remember that in our credit-money system, if the private sector isn’t lending new money into existence then the public sector has to or the money supply contracts. The Fed needs to get the private credit machine running again to get credit expanding at a 12% annual rate as it has since 1950 until 2008, shrinking 6% ever since, to get GDP growing at an average of 3.24% as it has since 1950. Think of the economy lugging along on a reserve tank of credit fuel, central government credit, as the main tank of private credit is empty. The economy has been running on it since 2009, but only delivering near stall-speed economic growth.
CI: How many more years do they have before the government credit gas tank, so to speak, runs out?
EJ: The Japanese have been moving private debt to public account for decades. From the standpoint of currency depreciation is needed to escape a post-asset bubble liquidity trap, Japan has the misfortune to be on the wrong side of an International Monetary System that favors debtors over creditors. Cross boarder capital flows naturally cause the dollar to weaken when U.S. policy makers wish, merely by the act of worsening the country's fiscal position. It’s like a kid getting a candy bar every time he kicks his sister. It’s not fair to sis, but what’s she going to do about it? In fact the Japanese are finally fed up with this. They re-elected Abe who made a pro-inflation and currency depreciation stance a major part of his campaign platform. They’ve already jawboned the YEN down 15% against the USD so far this year. We look into the recent significant in Japanese economic policy in Part II. We also delve into gold and the International Monetary System (IMS), including a 180 degree turn by the IMF on the subject of capital controls: now they're for them, at least on a limited basis. You can't talk about gold without talking about oil, and vice versa, so we devote energy to that. Framing all of it is an estimate of the timing and severity of a recession.
Hope and Fear – Part II: Year of Peril

Meanwhile, back in the real world...
• How not to forecast a recession
• The right way to forecast a recession
• Asset Class Price Dynamics in the Year of Hope and Fear
• Troubled Nation Watch List - Japan
CI: Where are we in the credit-fueled boom-bust cycle? For two years or something like that you have talked about a recession like in 1937. The recession interrupted the recovery from the early 1930s recession.
EJ: In a way like 1937, with respect to politics and bad economics determining policy, the wrong policy at the wrong time, but with less severity. The mid-gap recession that inadvertent monetary tightening and budget balancing caused in 1937 and 1938 toward the end of The Great Depression shrank the economy 6.6% of GDP. Investors, still traumatized by The Great Crash and its aftermath, freaked out and sent the stock market down 50% in a year. By contrast the mis-named Great Recession of late 2007 to early 2009 shrank the economy by 7%, that is, was barely larger than that secondary output gap recession of The Great Depression. The secondary mid-gap recession I see developing, maybe for 2013 if the cards don't fall the right way, may be only minus 1% or 2% of GDP before Congress panics and hits the spend button again.
CI: How do you forecast a recession in this environment?
EJ: Not the same way we forecast the 2007 to 2009 recession, or the 2001 recession. Recessions are like snowflakes. No two are alike but they all share similarities. All recessions are caused by a sudden decline in demand, but the causes of that demand hit differ with each recession, depending on the special circumstances of the economy at the time. The last recession was triggered by a credit market collapse. When we forecast it for Q4 2007 a year ahead of time in the fall of 2006 we focused on the MBS market, the nexus of the credit crisis. Needless to say the BMS market is irrelevant today in a recession forecast, as a trillion plus of it still resides forlorn and unloved on the Fed's balance sheet. The recession before that was set off by a stock market crash. Via a combination of the negative wealth effect and plain old fear, consumers headed for the hills and producers laid them off. In those days our recession forecasting focused on the timing stock market bubble collapse itself, which we got right to the month. But the stock market crash as a cause of future recession is irrelevant today. The recession before that, in 1990, was caused by a combination of banking sector crisis from the S&L debacle and a spike in oil prices from by Gulf War I. Had iTulip been around at the time I think we would, I hope, we would have focused on the banking industry and oil markets to try to time a recession. The recessions that ran from 1980 to 1983 were purposely induced by the Fed to end the 1973 to 1980 inflation spiral. That recession was all about Fed policy. I'd like to think we'd have figured out what the Fed was up to in time to buy 30-Year Treasury bonds with both hands. They handily beat stocks hands down over the next 30 years, contrary to popular delusions of stocks, dividends included. Before that the recessions of the early 1970s and mid 1970s were caused by a combination of oil price shocks and failed Fed attempts to slow inflation.
The point is that the methods that worked for us to forecast the last two recessions, and theoretically any previous recession, will never work again. One has to constantly retool. First you have to figure out where the recession is going to come from and then devise a set of leading and coincident indicators to detect and then confirm the approach of a recession.
CI: Are we going to have a recession in 2013? A mid-gap recession, as you call it, before the output gap closes from the last recession?
EJ: We will have a recession before the 6% of GDP output gap closes. That is a 100% certainty in my view. Whether we get it this year is another matter. If we do get a recession in 2013 it will arrive as a one-two punch. First comes a repeat of the error of lessening fiscal accommodation during an output gap that isn't closing due to private credit market debt deflation. Last time that happened was in 1937, under peculiarly similar political circumstances. That said, the 2007 to 2009 recession produced an output gap less than 1/3 the size of the 1930 to 1933 recession that launched The Great Depression. The mid-gap recession of 1937 and 1938 was itself as large as the so-called Great Recession, a term I dislike because it confuses a recession with the output gap that results from a recession. A depression is a really big recession followed by a very long output gap that lasts for many years. Anyway, the tax increases and spending cuts won't cause the recession. They will slow growth to the point that external shocks that are otherwise easily absorbed instead send the economy into recession. But before explain the right way to detect the onset of a recession under unique circumstances, as is the case of each recession, let me show you how not to forecast a recession.
How not to forecast a recession
Economists Marcelle Chauvet and Jeremy Piger, referred to as C/P below, developed a recession probabilities model in the late 1990s. Data are available on the St. Louis Fed web site:
Smoothed recession probabilities for the United States are obtained from a dynamic-factor markov-switching model applied to four monthly coincident variables: non-farm payroll employment, the index of industrial production, real personal income excluding transfer payments, and real manufacturing and trade sales. This model was originally developed in Chauvet, M., "An Economic Characterization of Business Cycle Dynamics with Factor Structure and Regime Switching," International Economic Review, 1998, 39, 969-996.
At the end of November 2012 excited chatter on the Internet predicted recession because the October C/P model was at the time showing a reading of 20%.
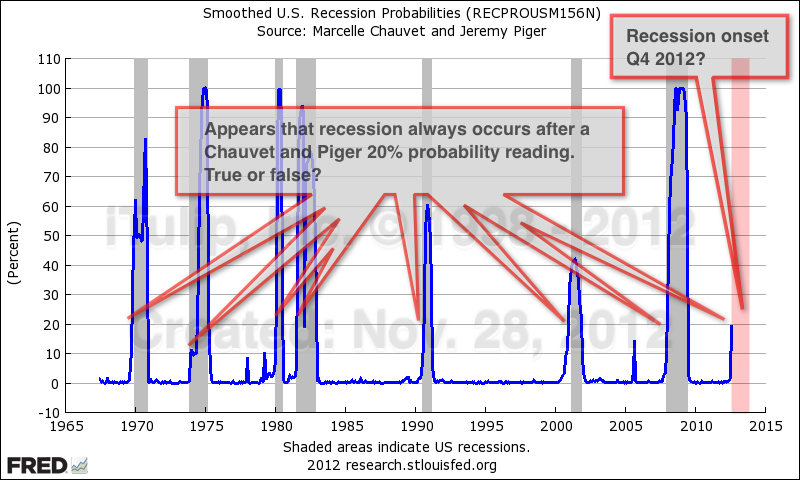
Is recession in Q4 2012 a sure bet per Chauvet & Piger the recession probabilities measure?
At first glance it appears that recession was inevitable as every previous reading of 20% or less has been followed by recession. But, as usual, the devil's in the details. Let's look at each recession in detail. We add the S&P500 into our close-up charts to see if stocks forecast recessions any better than the C/P business cycle model. (more... 9,000 words, 46 charts... $ubscriber)
iTulip Select: The Investment Thesis for the Next Cycle™
__________________________________________________
To receive the iTulip Newsletter or iTulip Alerts, Join our FREE Email Mailing List
Copyright © iTulip, Inc. 1998 - 2012 All Rights Reserved
All information provided "as is" for informational purposes only, not intended for trading purposes or advice. Nothing appearing on this website should be considered a recommendation to buy or to sell any security or related financial instrument. iTulip, Inc. is not liable for any informational errors, incompleteness, or delays, or for any actions taken in reliance on information contained herein. Full Disclaimer
Up, up and away or photoshopped recovery?
“It is my guiding confession that I believe the greatest error in economics is in seeing the economy as a stable, immutable structure.”
- John Kenneth Galbraith - A Journey Through Economic Time (1994)
• Fiscal stiffs
• Best laid plans
• No gold but oil
How did the doomers get 2012 so wrong? They spied the Mayan calendar and saw end-times December 21. Less credulous eyes saw the 13th Mayan Baktun, each Baktun lasting 144,000 days, ending on December 21. To the instant that end was followed by the 14th Baktun. This, the new and current Baktun that we are in, will end in another 394.3 years. Then another Baktun will start. On and on forever, as was the Mayan's philosophy of time.
Lesser doomsday scenarios also failed to materialize for the same reason: careless analysis.
The euro zone didn't disintegrate, Japan's bond marked didn't blow up, China's economy didn't melt down, oil prices didn't crash, and the U.S. economy did not collapse into a second Great Recession.
Defying expectations of doom, the benign economic events of 2012 set the stage for complacency in 2013, despite lingering post-financial crisis anxiety. Above the distant clatter of war sabers in Asia and a metastasizing Islamic extremist threat in North Africa, the comforting hum of recovery dominates the sphere.
The housing market correction that began in 2006 leveled off in 2012. Prices begin to rise as long-term unemployment finally eases. The kids move back out of Mom's and Dad's house where they took refuge after the crisis. New households begin to form again and relocate to new jobs that are at last appearing.
The debt ceiling standoff will end in a stalemate as did the fiscal cliff. The ECB will pledge more funds to prevent a liquidity crisis in the euro zone next time one arises. Barring war, China will continue to shuffle paper and fib its way to meet growth expectations.
All of these salubrious trends, taken together, may not be enough to excite the animal spirits into speculative fervor but will be enough to lull investors into the kind of complacency that can later lead to bullish optimism and all of the errors of judgment entailed.
What could possibly go wrong, outside of the unlikely event of Japanese and Chinese warships or fighter jets bumping into each other as they contest awkwardly for the Insecure Nations Sovereign Rights Defense Vigilance Prize in the East China Sea?
Not all signs point to the kind of self-sustained recovery that justifies the optimism I'm seeing today.
Retail sales were exceptionally sluggish over the holidays. Two years of recession then three years in an output gap turned American consumers into an army of bargain hunters. In no hurry to spend paychecks that are shrinking by inflation on one end and by taxes on the other, consumers are delighted to find goods on the shelves at fire sale prices as the new year begins.
In keeping with our long-term forecast, brutal competition among producers for the dwindling purchasing power of the American consumer will continue to thin the producer herd until there are only two majors left standing in each consumer segment, who by virtue of lack of competition gain pricing power, driving inflation further up and consumer purchasing power deeper down.
This promises to be a year where inflation stirs beyond food and energy prices, but not enough to gain the public notice of a Fed that has committed itself in writing to zero interest rates through 2015.
Thanks to an 11th hour compromise between the White House and the GOP to end the fiscal cliff standoff, America's $40,000 median household income will shrink by an average $1,000 as payroll tax deductions rise.
The folly of raising taxes during an output gap will be relearned in 2013 but not until the second half of the year. By then the cumulative impact of weak and declining demand in Europe and the U.S. may join with higher taxes and low productivity gains to leave the economy vulnerable to minor shocks. The stock market is on track to rally right into it, as it always does, creating a trade opportunity for the adventuresome who seek advantage over the herd.
The herd is driven by two kinds of fear: fear of losing money and fear of losing out on gains that the other guy might be making. The second kind of fear, the fear of missing out, motivates the masses to take great risks. It is commonly mistaken for greed. Greed exists but is exceedingly rare. One in a million investors is wily and courageous enough to be greedy whereas the vast populace seethes with resentment at any friend, neighbor, or random stranger who has or appears to have more than they do, no matter how hard they worked for it. The unscrupulous populist politician taps into this deep and ever-ready reservoir of resentment for votes, quick and dirty. The statesman avoids it because the genie of resentment of the strong by the weak once released is loathe to return to captivity. Ask Chairman Mao.
As the dust settles from 2012 it will be learned that quite a few investors made a lot of money in the stock market last year. This will anger enough investors who have been sitting it out since 2009 to inspire them to chase the dream in 2013. They will drive up stock prices, at least in the early part of this year, and even drive bond prices down in the bargain, fulfilling the Great Rotation wish of many a fund manager pining for a fat 2013 bonus.
It won't surprise me to see the S&P500 break through the 1550 level that's held it back for more than 12 years as the interest rate on a 10-Year UST reaches 2.5% before the stock rally ends and a recession begins. Such is the perennial disconnect between the emotions of the crowd and the reality of the crowd's real circumstances.
But none of this is of great importance in the grand scheme of things, and it is the grand scheme that has since 1998 been our mission to analyze and understand.
Unlike the harsh -7% of GDP mid-gap recession of late 1937 and early 1938, a mid-gap recession of 2013 if it happens will be short and shallow, in the area of -1% to -2%. The Fed's response, if the recession happens, will be as predictable as the response we forecast here in 2006 when we foresaw a severe, multi-year recession to start at the end of 2007. We said the Fed was going to unleash a river of money on the world and put bad loans on its balance sheet, that is, all the stupid, unprofitable bets made by the banks that the Fed was supposed to be regulating. By this expedient the Fed avoided a deflationary depression, also predicted here. Instead, we said, we'll get a grinding recovery, with wages deflating against commodity prices. And so it was.
The year 2013 is the fifth year of The Great Debt Deflation that began in 2008 and will continue until a new epoch begins, the one that we have since 2006 referred to as Period X. With each new, boil-the-ocean analysis here, Period X looks increasingly like a funhouse mirror image of The Great Credit Inflation of 1983 to 2008, but shorter and in the other direction, with interest rates rising and the growth benefits of a continuous re-financing of debt across the economy reversed.
Time is the great teacher. Four years ago in January 2008 we proposed three scenarios of a complete reversion to the mean of the Real DJIA growth rate. At the time we forecast of a 40% decline in the stock market that year. In the event the correction took the trajectory indicated below identified by the numeral 1. However, instead of a correction all the way down to the mean grow rate, reflation policy -- currency depreciation, rate cuts, and deficit spending -- stopped the correction well above the mean and reversed the correction.
iTulip DJIA as Economic Yardstick January 2008
• Economic history as reflected in the DJIA is divided into nine periods A - I and Period X when unsustainable trends
that began in 1994 revert.
• Possible futures of the DJIA as seen by iTulip in Jan. 2008 the month after we forecast a 40% decline in the DJIA for that year.
• The DJIA was forecast to revert all the way back to the 1924 to 1994 growth rate.
iTulip DJIA as Economic Yardstick 2013
• Economic history as reflected in the DJIA is divided into 15 periods A - O and Period X when unsustainable trends
that began in 1994 revert. Grey indicates recessions.
• The DJIA did correct 40% as forecast but not to the long-term rate.
• Possible futures of the DJIA as of Jan. 2013 are conditional: If central bank and government spending succeed in
restarting private credit growth then stocks recover to the Great Credit Inflation growth rate, else they revert to the long-term rate.
Why did the stock market take off in 1994? The answer is hidden in plain sight, in the Fed Flow of Funds data. Starting in 1994, the long-term relationship between debt outstanding in the Federal Government Sector of Non-Financial Sectors and Domestic Financial Sectors ended. From the 1953 until 1994, the two netted to close to zero. Starting in 1994, Financial Sectors Debt Outstanding started to take off, peaking at $11 trillion in excess of Federal Government Debt in 2008. It's been declining ever since. As it has, the output gap created by the last recession remains stuck open at 6% of GDP.
Financial Sector Debt Outstanding (DODFS, green line, log scale left). Federal Government Debt Outstanding (FGSDODNS, red line, log scale left).
Federal Government Debt Outstanding minus Financial Sector Debt Outstanding (FGSDODNS - DODFS, blue line, linear scale right).
GDP (GDP, orange line, linear scale right)
The chart above frames the first half of the existential challenge facing our economy: if not for a huge increase in government spending to compensate for the decline in private sector credit, the economy will fall back into recession. A similar situation has confronted Japan since 1994.
The credit bubble left the economy dependent on deficit spending. The deficits are structural but Congress and the White House treat them as secular, ignoring the $11 trillion in excessive credit growth that bloated the economy to its current size. Expectations are embedded in Real Potential Output. The delta of reality and potential is the Output Gap.
This circumstance is not understood even by the Fed. I asked #2 in command there directly last November and got an answer as vague and indicative of cluelessness as answers I received from Larry Summers and others who are generally considered among the elite who develop policy.
But the problem is understood by at least some members of Congress, one of whom is including some of my analysis in his book coming out later this year. There's hope for us, except for the second half of our economy's existential challenge that no one in power is eager to discuss as a public policy issue: Peak Cheap Oil (PCO).
Feeding this year's bullish attitude is the discovery that if you spend enough money, you can get heaps of oil out of the ground right here in the USA.
The excitement in the media in the opening weeks of 2013 over a major increase in domestic oil production since 2008 needs to be tempered by the reality of the cost of that production. The trend in production per rig that began with the onset of PCO in 1998 accelerated with the cumulative investment of $450 billion since 2008 needed to get that oil flowing. As we see in Part II, the resulting favorable impact on the balance of trade showed up in the gold price in 2012. As long as oil keeps getting more expensive the U.S. will be able to increase domestic production. Leave it to the oil industry flacks over at the Energy Information Administration to spin this as good news, as if a rising tax on the economy imposed by higher oil prices is going to help get the economy moving.
The gold market caught on to these dual existential challenges in 2001. So did we, buying the stuff on the theory that structural deficits produced by asset-bubble dependence cannot end any other way but in competitive currency depreciation, of which gold is the best currency as it is the least printable.
Our methods of analysis have evolved and improved since then. Today we know that a forecast of the mean reversion in the price of any asset class, such as stocks and bonds, is complicated by the agressive involvement of government and central banks, both indirectly by spending into the economy and depreciating the currency via liquidity operations, and directly in asset markets themselves via bond purchases ala QE1, QE2, and QE3. The size of government and central bank balance sheets is underestimated by pessimists and over-estimated by optimists. Our view is that these methods will work until they don't. The name of the game is determining the thresholds and triggers in extremis. In the long run we think the pessimists will be proved right, and the reconciliation between the reality of markets and the fantasies of academic government bureaucrats will occur in what we call Period X. In the mean time there's money to be made.
The doomers had it wrong on the Mayan calendar but maybe the Mayans had the right idea about time itself. There's wisdom in a calendar that looks out beyond the next 12 months, decades off into the future. A year is too short a slug of time to gauge the deeds of men, good or bad, and their institutions, well conceived or not. Twelve months is entirely too arbitrary as a timeframe for gauging the convoluted processes of change in the political economy that we have followed here on iTulip since 1998, changes that began well before we started and will go on long after we're gone. The mission here is to understand our world from without, to abstract ourselves and look down upon our earth as curious and disinterested aliens might, yet at the same time remain cognizant of our purpose, to continue to build on the understanding we have developed here over the past 14 years, to truly know where we stand in our time and in this place and take the best advantage we can of that knowledge.
Within the Mayan calendar's 394.4 year Baktun are 20 periods of 19.7 years called Katun. One Katun from November 1998 when this site's investigations started ends in 2019. That year may be a year worth planning for, as by that time major trends are destined to reach an inevitable conclusion one way or another. Maybe there's something to the Mayan calendar after all.
Eric Janszen
President, iTulip.com
January 19, 2013
(Editor: iTulip gratefully acknowledges the contributions of multiple Community Interviewers who contributed to this article via Ask EJ and other subscriber posts since November 2012, and here in this article.)
Fiscal Stiffs
CI: Can the battle between the White House and Congress over the ceiling cause a Petite Default? Is there a trade in there? (Hat tip to member XPat for asking the original question.)
EJ: As I explained in my previous article, the risks posed by a default, no matter how small, are serious. For that reason it will be avoided.
CI: Talk about the risk, if it did happen.
EJ: As the world's largest economy that issues the world's primary reserve currency the U.S. can get away with foolish behavior that would wreck any other country's currency and trade status. Crashing the world economy with a collapsed securitized debt bubble, for example. But failing to make each and every Treasury debt payment on time and in full is the one mistake we don't get to make.
Depending on the size of the default, that is, how large the payments are that are missed, yields will rise across the yield curve and will not recover -- ever. That "default spread" will get imbedded in the UST yield curve for decades. Creditors are unforgiving of debtors who fail to make payments. That's the way it works.
You are asking, What if the impossible happened?
That depends on: 1) How big is the default exposure, and 2) What can the administration do to mitigate it?
Here's the situation as of Monday, Jan. 14, 2013.
As of Monday when Treasury last released public debt data the debt subject to the statutory debt limit was a mere $25 million away from or 0.00015% of the limit. Those levels have remained there since Dec. 28, 2012 when the public debt subject to the limit was $95,978,000,000 or a relatively cushy 0.58% away from the limit.
Extrapolating we can guess that by the end of January the U.S. Treasury will be in the neighborhood of $100,000,000 over the limit if it isn't raised.
As predictable as this trend looks toward a February 2013 doomsday scenario, there are three factors worth noting for anyone who is thinking about a trade around a potential Petite Default.
One is that the limit to debt gap closed by $32,874,000,000 from November to December last year. If you look at the complete history there is significant seasonal and other variability. The gap may be less than $100 billion, but it doesn't need to be that large to wreck havoc on the yield curve if in fact payments are defaulted on. The gap is unlikely to be less than $30,000,000,000 given long-term trends.
Two, we have to assume that the administration and Congress are not as stupid as they look. It is a near certainty that a Plan B exists such as moving funds among accounts to pay down debt ahead of schedule, and buy time.
Three, neither the fiscal cliff follies nor the debt ceiling standoff had any noticeable impact on bond yields. The long end has been creeping up since July.
As in the case of the Fiscal Cliff power struggle, I think Congress is again underestimating how strong a hand the White House has to play.
I think they'll either avoid hitting the debt ceiling by raising the limit in time or if the deadline isn't met they will shuffle the bills around to make debt payments but not other payments until they work out a deal.
Fitch reported earlier this week that it may downgrade U.S. debt if the Treasury defers payments to debt versus paying other bills. As if anyone cared anymore what Fitch has to say about credit ratings. If that's the best card that the other side has to play against the White House, this will all be over soon. (This was written a week before the GOP offer appeared on Jan. 18, 2013).
Which is not to say the whole debt ceiling affair isn't upsetting and unsettling. One of our members think365 put it best: "The problem is that the fiscal appropriation and budgeting process is disconnected from the debt ceiling debate. No private corporation could get away with such irresponsible fiscal management. It would be like the board of directors and its management approving an annual cap-ex/expense budget for the coming year and entering into binding vendor contracts before you have checked with your bank(s) to make sure your line of credit can be increased to cover your budget. No competent CFO in the private sector would allow such irresponsible "cart-before-the-horse" financial mismanagement which would immediately trigger bank loan covenant violations and very likely affect (negatively) the company's credit rating."
He then quoted the U.S. Government Accountability Office expressing it this way:
"The debt limit does not restrict Congress’s ability to enact spending and revenue legislation that affects the level of debt or otherwise constrains fiscal policy; it restricts Treasury’s authority to borrow to finance the decisions already enacted by Congress and the President. Congress also usually votes on increasing the debt limit after fiscal policy decisions affecting federal borrowing have begun to take effect. This approach to raising the debt limit does not facilitate debate over specific tax or spending proposals and their effect on debt. In February 2011, GAO reported, and continues to believe, that Congress should consider ways to better link decisions about the debt limit with decisions about spending and revenue to avoid potential disruptions to the Treasury market and to help inform the fiscal policy debate in a timely way." - GOA Highlights Newsletter (July 2012).
Our comment is visual:
And it's not going to get better.
Fed Follies
CI: The Fed recently announced that it had no intention of raising interest rates until unemployment fell to 6.5% or lower. Were you surprised by thus explicit target? Is this a throwback to using the output gap and employment to determine rate policy?
EJ: A 6.5% unemployment rate has been implicit Fed policy since the 1950s. The chart below is from my previous article, posted November 2, 2012. It notes that the accommodation threshold rate of unemployment is 6.5%. The Fed never raises interest rates if unemployment is above 6.5% and it's not going to start now.
If you want to know where the Fed's head is at on policy timing, get a load of the latest NAIRU or Natural Inflation Rate of Unemployment projections.
If you are wondering how they arrived at 6% for long-term NAIRU we fit Mean Duration of Unemployment on the right hand scale and add a dashed green arrow to indicate the Fed's implied projection for a decline in Mean Duration of Unemployment.
The Fed expects a return to a healthy, pre-crisis level by, say, the year 2022. Eagle eyed readers will recall a similar projection made by us last September based on other Fed and also IMF data.
I don't think any of these projections will come to pass. The NAIRU-based projection for a return to pre-crisis unemployment by 2022 assumes that the U.S. economy will grow continuously without another recession for 13 years from 2009. The longest stretch of recession-free growth that the U.S. has experienced was between 1990 and 2001, and as I've argued that boom was considerably extended by a stock market bubble. In the unlikely event that the next recession can be put off until 2018, NAIRU will make a U-turn as Median Duration of Unemployment rises anew.
With interest rates already at zero the Fed will have few options for monetary stimulus, leaving fiscal stimulus to the work of cushioning the blow to the economy. Along with rising unemployment comes rising budget deficits as tax revenues fall and outlays to cover unemployment insurance, food stamps, and other social supports expands.
This has always been my beef with the Fed for allowing the stock and housing bubbles to occur in the first place. The Fed's deflation fighting papers laid out a clear plan for dealing with the immediate crisis but they didn't think through the long-term implications. Once an economy is this damaged it effectively needs a complete reset to get it back on track again. The U.S. economy got a reset in the form of WWII last time it got stuck in an output gap this way. It's not at all obvious how we're going to get out of it this time.
Nexus of Confusion
CI: Back to the long view. How does 2013 fit into the vision you have of the economy after running this site for 14 years?
EJ: The first thing to keep in mind is that stability is an illusion. Every crisis is followed by a recovery when the seeds of the next crisis are planted. The name of the game is to dodge the crises and play the recoveries. That in a nutshell is the art of life applied to investing in our time.
CI: Easier said than done. Rate yourself.
EJ: With respect to identifying and profiting from crises since 1998, I’ll give myself an A. We dodged and profited from two major crises since going into operation, in 2000 and 2007. We played stocks right up to the spring of 2000 and again into the winter of 2007. But I can’t give myself better than a C for taking best advantage of the recoveries that followed, particularly the post tech bubble recovery. Yes, we bought bonds at an intermediate bottom in 2000 and gold at the structural bottom in 2001, and, yes, holding those produced the best risk-adjusted return when benchmarked against a standard portfolio of stocks and bonds, but we could have done better. We're always learning.
CI: What are you doing to improve on that?
EJ: I'll describe it as a change in philosophy. Remember, we didn't buy gold in 2001 to make money. We bought gold to hedge the effects of a transition of the international monetary system from dollar-centric to multi-lateral, at first slowly as has occurred since 1999 then suddenly ala the Janszen Scenario if and when global investor sentiment shifts suddenly against the dollar. As our long-term Treasury bonds have matured, those that we haven’t rolled over into short-term bonds are being invested in private equity, that is, in start-ups and funds that are consistent with the investment thesis we have developed here over the past 14 years. The private equity investments we’ve made since early 2009 are both an effort to reduce direct exposure to bond duration and to take full advantage of this recovery while it lasts, before the next crisis.
CI: Do you think the next crisis will be the final blow-up, the Big One that caps the 30+plus year USD credit bubble?
EJ: The latest analysis puts that eventuality further off into the future, out to, say, around 2019. We've shifted Period X further off.
CI: Period X in your 2008 writings starts in 2009. Now you're saying it's around 2012?
EJ: In 2011 I thought it might start in the 2012 - 2013 timeframe. You may recall this flow diagram from January 2011.
Peak Cheap Credit + Peak Cheep Oil = Public Credit Market Crisis
With minor improvements this is still the crisis process as we see it, the collision of Peak Cheap Oil and The Great Debt Deflation, but it's going to take longer than we originally though. We took a different approach that I think gets us closer to an understanding of how long the system such as it is can persist, that is, how long we have to make hay while the sun shines.
CI: If you see a Big One in a Period X off in the distance why invest in risky start-ups and funds?
EJ: We started our diversification out of long duration bonds and into funds and start-ups in June 2009. For example, Eastham Capital Fund II was a bet on rising rents and cap rates in 2010. It is producing returns well above expectations, judging by the response of iTulip folks who were recently polled: 100% said they were highly satisfied with it. Making these investments may appear contradictory on the surface but we have the downside risk of Period X covered with gold and short-term UST. Perversely, these hedge positions have produced far better risk-adjusted returns than stocks over the period. But with UST earning virtually nothing and with little room left for yields to fall and prices to rise, the only logical place to put capital to work is with entrepreneurs. They are the one asset class that we trust the most. The problem is that entrepreneurs are not a scalable asset class; there are only so many men and women who have what it takes to build and run a business, especially in this environment. If I hadn't spent 30 years in the high tech industry and 15 years involved in due diligence of technology companies I would not attempt it, and still I'll make plenty of mistakes.
CI: How does this philosophy apply to fund investing?
EJ: We don't just invest in any funds we invest in funds run by people who run funds the way entrepreneurs run a start-up. These are focused, independent people with skin in the game.
CI: What if Period X comes early?
EJ: Could a major crisis occur before we get liquidity from these funds? Of course, but again the lesson of the past 14 years running iTulip is that sitting out recoveries is expensive, and we don't invest any more in these businesses and funds than we can afford to lose. Recall that the much of the funds for our Treasury and gold purchases made in 2000 and 2001 respectively came from start-up investments that saw liquidity in 1999 and 2000. This recovery is of course nothing like the 2002 to 2007 recovery that was driven by a mortgage securities bubble, but that doesn't mean there are not investment opportunities for the diligent to be made while the sun shines.
CI: While it lasts. Might we get a head-fake minor crisis before The Big One?
EJ: I'll rephrase the question as, Will the next crisis be the big one that finally caps The Great Deflation with a surge of inflation to deflate the debt left over from The Great Credit Inflation against commodity prices and wages? To arrive at that question you first have to investigate and think through the process of economic development via a crisis and recovery that led up to this point. Over the past century there have been small crisis-recovery periods embedded within large ones, for example the decade of stock and housing bubbles embedded within a 25-year national credit bubble and international USD liquidity bubble. The recovery since 2009 is fundamentally different from any since March 2000 when we marked the top of the stock market bubble here. We launched iTulip.com four years into the 1994 to 2008 rapid expansion phase of The Great Credit Inflation that began in 1983, after The Great Inflation of the 1970s ended. That expansion spun off an equity bubble from 1994 until 2000. We arrived for the final two years of it when the hysteria phase of the tech bubble was in full swing. A mortgage credit bubble followed from 2002 to 2006. The whole 25-year shebang that I call The Great Credit Inflation ended in 2008. We have been in The Great Debt Deflation era ever since. I have a theory that I argue in Part II about how long it may last and why. It’s important to not get caught up in the present or the recent past but to take a longer view and to avoid making careless analogies between one period and another in history.
CI: Do you miss the bubble days when you first started iTulip?
EJ: Of course. Riding it up was exhilarating and selling at the top was fun, but the 12 year ride down since has fairly sucked, despite the fact that I expected it, as readers who've been with us throughout full well know. But it's not the ride down from the bubble top that worries me. Life is certainly harder today than it was for most people a dozen years ago, but things are not that bad. If you look at the data one interpretation is, Okay, so we're about where we would have been if we hadn't had the stocks and housing parties. We've taken our lumps but the worst is over. From now on it's going to be like it was in the early 1990s before the bubbles inflated the economy, with moderate growth not juiced up with asset price inflation. That's an optimistic view and I think one that represents the consensus today.
CI: Do you agree?
EJ: Every interpretation is worth investigating. Take housing, for example. One interpretation of the data is that housing price declines are finally leveling off. From here they may begin to rise to the trend growth rate that was established from 1975 until 1995 when housing prices diverged from trend. We use the FHFA's National All-Transactions House Price index and the Case-Shiller National Composite Home Price Index together, both indexed to 1990.
Reversion to the mean, yes, but will a government-backed secondary mortgage market and Fed-subsidized
mortgage interest rates continue to deliver a full regression and sustained recovery?
An optimist looks at this and says it's time to jump back into housing, but government subsidies of the housing market have played a major role in creating what appears to be a typical reversion to the mean from a price bubble. In particular, Fed purchases of mortgage securities and two government owned and run banks, Fannie Mae and Freddie Mac, buy 90% of the mortgages originated by private lenders. You have to ask, Can the federal government's and the Fed's balance sheet sustain these subsidies until the housing market can stand on its own? What will happen if they can't? Even if they do and we return to 1975 to 1994 home price growth rates, these never exceeded inflation over the period, so does that make housing an investment or a place to live that is hedged against inflation? This line of thinking holds true for equity and bond market data as well. Until government supports are completely withdrawn there's no way to know what the market price of any asset is. What is the mean growth rate for a market that is dependent on government finance? How can prices revert to those means as long as government finance is extant?
CI: Does this apply to stocks? Your real DJIA chart above suggests a huge correction in the future.
EJ: There's another way to look at it that's worth thinking about. Call it the One Think After Another model. As an alternative to our Real DJIA chart at the beginning of this article, consider the chart of the Wilshire U.S. Large-Cap index on a log scale below. A log scale does not adjust for inflation but it does smooth long-term asset price inflation variability. Twelve years after the stock market bubble peaked, stocks appear to be back on a healthy long-term trend from which they diverged in 1994. The second chart, using real estate security prices as a proxy for the housing market, shows how the stock market bubble collapse melded neatly into the rising housing bubble, propelled by low interest rates, unregulated MBS issuance, and unregulated home mortgage lending. The reflation from the collapse of the housing bubble via broad-based bond price fixing, asset price inflation via QE, has in turn produced a bubble in high risk debt, aka junk bonds.
One bubble leads to another.
Stimulus measures taken to produce the recovery since 2009 has produced a bubble in low quality, high yield debt starting around 2010. That bubble will pop some day and cause yet more havoc. Government keeps trying to use the Fed's and government's balance sheet to fix the damage caused by the previous administration's use of the Fed's and government's balance sheet. So one view is that this goes on and on and never ends. My view is that each crash and reflation process causes default and inflation risk to accumulate in the UST market, under the surface. As I've been saying since 1998, this can go on for quite a while but will end when the Fed's and federal government's balance sheets are exhausted. The gold price reflects the eventual venting of sovereign debt risk via the currency. We'll talk about gold at length in Part II. But again, there are more games to be played to push out the day of reckoning. Central government credit risk can be re-distributed among the states, the U.S. can lower currency risk due to trade imbalances by producing more domestic oil, and so on.
CI: You're saying your concern is not that this is a post-bubble New Normal that the U.S. economy has reverted to after the stock market and housing bubbles. There's more reverting to go?
EJ: We witnessed, or lived through, or were privileged to enjoy, arguably the most expansive social and economic period in human history, from roughly 1983 to 2008. The Soviet Union disintegrated, global financial markets were liberalized and freed from state control, inflation was tamed in all major economies and most peripheral ones as well, global credit markets bloomed, money poured into the U.S., cheap oil flowed, and wars were relatively small and contained. Rapid technological innovation in everything from energy to communications was both a big assist to this transformation and a result of it. But the seeds of the undoing of this expansion were planted along the way. The most outstanding and irreconcilable of these resulted from the perpetual private sector credit expansion that fueled the expansion as interest rates fell: debt. Private sector debt peaked around 120% of GDP in 2008 and has fallen to 90% since. This has never happened before.
Referring to the chart below, Financial Sector Debt Outstanding per the latest Fed Flow of Funds (green line, left hand scale) is shown on a natural log scale over 60 years. It is also shown as a percent of GDP (purple line, right hand scale). Looking at this chart we ask, Is it possible that The Great Debt Deflation will not run to completion and turn out to be no more than a massive speed bump on the road to private sector debt in excess of 150% or 200% of GDP. I don’t see it. I don't see how the debt-to-GDP growth trend ever returns to the rate of the previous 25 years of The Great Credit Inflation era. The Flow of Funds data are clear enough. As I said back in 2008, the U.S. has only so long to get the private credit growth restarted before the U.S. government runs out of credit trying to keep the economy expanding via QE and government spending. GDP growth, such as it is, is highly dependent on deficit spending, to keep the money supply expanding by spending into the financial markets as well as into the economy itself.
CI: But Congress is obsessed with cutting the deficit, the Dems by raising taxes and the GOP with spending cuts. Is either wise while private sector debt is shrinking for years on end for the first time ever?
EJ: It's a symptom of the political response to the fact that the economic pie that credit made bigger for decades has been shrinking, and it is remarkably similar to the late 1930s when a Democrat dominated Congress voted to cut spending to reduce the deficit. Again, it's a classic case of one party becoming the agents of the opposition. In this case the Democrats are positioning for the next legislative election by reducing the deficit and cut off the opposition's future access to accusations of loose spending in the campaign. The rich will continue to be the primary political target for re-allocation of the pie as it shrinks during The Great Debt Deflation. Since 2008 when The Great Debt Deflation leaves one set of animosities behind as the economic high tides of the stock market and housing bubbles recede and an even larger collection of nasty political consequences as the legacy of The Great Credit Inflation, going all the way back to the early 1980s, becomes clearer to the populace. The long credit boom created a powerful rentier class that used wealth to gain economic advantage through the electoral system. Tax and regulatory legislation concentrated wealth and power further. Hardly anyone complained or even noticed when private credit expansion kept the pie growing but now that it’s shrinking we see the fallout is class warfare politics, the 1% versus the 99% and all that stuff.
CI: You warned about this as early as 2005 when you were writing for Always On. You said to expect social fragmentation along age, income, wealth, and race lines.
EJ: And as it turns out guns versus no guns, which is really a North versus South issue, adding that to the toxic political mix. Here in Massachusetts our populist governor plans to cut sales taxes and raise income taxes on high income earners. It's the kind of progressive tax policy that you see in societies where opportunities for the middle class to advance are evaporating, usually due to corruption and government mismanagement. The result of these policies is of course to cause opportunities to advance to become even fewer. One of our members GRG55 put it best when he said, and I'm paraphrasing, if government wants people to use less gasoline it taxes gasoline more, and if it wants them to smoke less it taxes cigarettes more, and if it wants people to work less it taxes incomes more. Works every time. On an international scale we have localized conflicts morphing into regional wars and the rise of totalitarian capitalist regimes like China that are set to take the other side in these conflicts as well as externalize domestic political challenges by playing on popular anti-Japanese sentiment.
CI: You started iTulip.com near the apex of the stock market bubble. Has the economy developed the way you expected since then?
EJ: Not at all. Yes, I expected the NASDAQ to fall 80% then stay 50% below peak for a decade, for the Venture Capital industry to underperform for a decade as liquidity events became fewer and smaller, and for the core of the tech sector to contract, that is, the part that creates the platform companies like Intel, Microsoft, and Apple. But again in the broader sweep of history, the tech stock and housing bubbles of the bubble era were only meaningful to us because they were the most dramatic events, at least to date, to happen to us as adults with an interest in and understanding of the economy and markets. Was the bubble era more dramatic than The Great Inflation of the 1970s or the FIRE Economy era of falling inflation, plunging interest rates and exploding debt and deficits that followed? Not really. I think the resolution of The Great Debt Deflation will be the defining era for the generation that came of age during the 1980s when the long credit-fueled booms started.
CI: Those of us born in the 1980s it’s like the economy boomed all our lives until 2001. After that it feels like the economy has been on one form of life support or another.
EJ: There’s never a dull moment, never a period of time when the economy is not heading into a crisis, going through a crisis, or recovering from a crisis. Every recovery is simultaneously a period of improvement and build up to the next crisis. It has always been so. The Great Inflation of the 1970s followed the 1950s and 1960s post-war boom. The U.S. started that era as the world’s dominant manufacturing and export power but ended it with a shrinking trade balance as the rest of the world caught up and U.S. politicians got the idea that the nation had an infinite pool of taxable incomes to spend on a global policing role and social welfare projects. But it’s forgotten that immediately after WWII the U.S. economy faced a major inflationary crisis as the war economy transitioned to a consumer economy. A consumer demand shock slamming into production rigidities. You could say the wartime boom planted the seeds of that crisis. That high employment boom of the war economy era had a flip side, labor shortages and high inflation despite wage controls. As the consumer economy became a war economy in the early 1940s, personal consumption expenditures fell from 80% of GDP to 50% as production shifted to war output. The privations of The Great Depression, and the Great Depression set the stage for a world war between states based on totalitarian and democratic political systems. That depression followed the excesses of a credit boom that followed a post-WWI recession, and on and on since the nation’s founding. It never stops. The challenge is in figuring out where you are in and how to play it. The special challenge of today is that the U.S. economy has been running at stall speed for years after clawing its way out of hell in Q2 2009. It won’t take much to push it into a recession. Weak holiday spending and other measures we’ll get into tell me the economy will drift slowly into recession this year.
What credit giveth, debt deflation taketh away. Private sector debt will continue to decline until it reaches 2% to 4% of GDP then rise as
interest rates rise.
Public sector debt will continue to rise until it reaches 8% to 9% of GDP then decline as interest rates rise.
CI: Why has federal government debt become the reciprocal of private debt?
EJ: As private debts are shifted to public account via government spending into the economy and the financial sector, Federal Government debt rises to compensate for declines in private sector debt. If it didn’t then the money supply would shrink. Remember that in our credit-money system, if the private sector isn’t lending new money into existence then the public sector has to or the money supply contracts. The Fed needs to get the private credit machine running again to get credit expanding at a 12% annual rate as it has since 1950 until 2008, shrinking 6% ever since, to get GDP growing at an average of 3.24% as it has since 1950. Think of the economy lugging along on a reserve tank of credit fuel, central government credit, as the main tank of private credit is empty. The economy has been running on it since 2009, but only delivering near stall-speed economic growth.
CI: How many more years do they have before the government credit gas tank, so to speak, runs out?
EJ: The Japanese have been moving private debt to public account for decades. From the standpoint of currency depreciation is needed to escape a post-asset bubble liquidity trap, Japan has the misfortune to be on the wrong side of an International Monetary System that favors debtors over creditors. Cross boarder capital flows naturally cause the dollar to weaken when U.S. policy makers wish, merely by the act of worsening the country's fiscal position. It’s like a kid getting a candy bar every time he kicks his sister. It’s not fair to sis, but what’s she going to do about it? In fact the Japanese are finally fed up with this. They re-elected Abe who made a pro-inflation and currency depreciation stance a major part of his campaign platform. They’ve already jawboned the YEN down 15% against the USD so far this year. We look into the recent significant in Japanese economic policy in Part II. We also delve into gold and the International Monetary System (IMS), including a 180 degree turn by the IMF on the subject of capital controls: now they're for them, at least on a limited basis. You can't talk about gold without talking about oil, and vice versa, so we devote energy to that. Framing all of it is an estimate of the timing and severity of a recession.
Hope and Fear – Part II: Year of Peril
Meanwhile, back in the real world...
• How not to forecast a recession
• The right way to forecast a recession
• Asset Class Price Dynamics in the Year of Hope and Fear
• Troubled Nation Watch List - Japan
CI: Where are we in the credit-fueled boom-bust cycle? For two years or something like that you have talked about a recession like in 1937. The recession interrupted the recovery from the early 1930s recession.
EJ: In a way like 1937, with respect to politics and bad economics determining policy, the wrong policy at the wrong time, but with less severity. The mid-gap recession that inadvertent monetary tightening and budget balancing caused in 1937 and 1938 toward the end of The Great Depression shrank the economy 6.6% of GDP. Investors, still traumatized by The Great Crash and its aftermath, freaked out and sent the stock market down 50% in a year. By contrast the mis-named Great Recession of late 2007 to early 2009 shrank the economy by 7%, that is, was barely larger than that secondary output gap recession of The Great Depression. The secondary mid-gap recession I see developing, maybe for 2013 if the cards don't fall the right way, may be only minus 1% or 2% of GDP before Congress panics and hits the spend button again.
CI: How do you forecast a recession in this environment?
EJ: Not the same way we forecast the 2007 to 2009 recession, or the 2001 recession. Recessions are like snowflakes. No two are alike but they all share similarities. All recessions are caused by a sudden decline in demand, but the causes of that demand hit differ with each recession, depending on the special circumstances of the economy at the time. The last recession was triggered by a credit market collapse. When we forecast it for Q4 2007 a year ahead of time in the fall of 2006 we focused on the MBS market, the nexus of the credit crisis. Needless to say the BMS market is irrelevant today in a recession forecast, as a trillion plus of it still resides forlorn and unloved on the Fed's balance sheet. The recession before that was set off by a stock market crash. Via a combination of the negative wealth effect and plain old fear, consumers headed for the hills and producers laid them off. In those days our recession forecasting focused on the timing stock market bubble collapse itself, which we got right to the month. But the stock market crash as a cause of future recession is irrelevant today. The recession before that, in 1990, was caused by a combination of banking sector crisis from the S&L debacle and a spike in oil prices from by Gulf War I. Had iTulip been around at the time I think we would, I hope, we would have focused on the banking industry and oil markets to try to time a recession. The recessions that ran from 1980 to 1983 were purposely induced by the Fed to end the 1973 to 1980 inflation spiral. That recession was all about Fed policy. I'd like to think we'd have figured out what the Fed was up to in time to buy 30-Year Treasury bonds with both hands. They handily beat stocks hands down over the next 30 years, contrary to popular delusions of stocks, dividends included. Before that the recessions of the early 1970s and mid 1970s were caused by a combination of oil price shocks and failed Fed attempts to slow inflation.
The point is that the methods that worked for us to forecast the last two recessions, and theoretically any previous recession, will never work again. One has to constantly retool. First you have to figure out where the recession is going to come from and then devise a set of leading and coincident indicators to detect and then confirm the approach of a recession.
CI: Are we going to have a recession in 2013? A mid-gap recession, as you call it, before the output gap closes from the last recession?
EJ: We will have a recession before the 6% of GDP output gap closes. That is a 100% certainty in my view. Whether we get it this year is another matter. If we do get a recession in 2013 it will arrive as a one-two punch. First comes a repeat of the error of lessening fiscal accommodation during an output gap that isn't closing due to private credit market debt deflation. Last time that happened was in 1937, under peculiarly similar political circumstances. That said, the 2007 to 2009 recession produced an output gap less than 1/3 the size of the 1930 to 1933 recession that launched The Great Depression. The mid-gap recession of 1937 and 1938 was itself as large as the so-called Great Recession, a term I dislike because it confuses a recession with the output gap that results from a recession. A depression is a really big recession followed by a very long output gap that lasts for many years. Anyway, the tax increases and spending cuts won't cause the recession. They will slow growth to the point that external shocks that are otherwise easily absorbed instead send the economy into recession. But before explain the right way to detect the onset of a recession under unique circumstances, as is the case of each recession, let me show you how not to forecast a recession.
How not to forecast a recession
Economists Marcelle Chauvet and Jeremy Piger, referred to as C/P below, developed a recession probabilities model in the late 1990s. Data are available on the St. Louis Fed web site:
Smoothed recession probabilities for the United States are obtained from a dynamic-factor markov-switching model applied to four monthly coincident variables: non-farm payroll employment, the index of industrial production, real personal income excluding transfer payments, and real manufacturing and trade sales. This model was originally developed in Chauvet, M., "An Economic Characterization of Business Cycle Dynamics with Factor Structure and Regime Switching," International Economic Review, 1998, 39, 969-996.
At the end of November 2012 excited chatter on the Internet predicted recession because the October C/P model was at the time showing a reading of 20%.
Is recession in Q4 2012 a sure bet per Chauvet & Piger the recession probabilities measure?
At first glance it appears that recession was inevitable as every previous reading of 20% or less has been followed by recession. But, as usual, the devil's in the details. Let's look at each recession in detail. We add the S&P500 into our close-up charts to see if stocks forecast recessions any better than the C/P business cycle model. (more... 9,000 words, 46 charts... $ubscriber)
iTulip Select: The Investment Thesis for the Next Cycle™
__________________________________________________
To receive the iTulip Newsletter or iTulip Alerts, Join our FREE Email Mailing List
Copyright © iTulip, Inc. 1998 - 2012 All Rights Reserved
All information provided "as is" for informational purposes only, not intended for trading purposes or advice. Nothing appearing on this website should be considered a recommendation to buy or to sell any security or related financial instrument. iTulip, Inc. is not liable for any informational errors, incompleteness, or delays, or for any actions taken in reliance on information contained herein. Full Disclaimer


Comment