 Tweet
Tweet
Reality Check, Election Edition – Part I: 1936 Election Recycled
Six years into the decade that came to be known as The Great Depression incumbent Franklin D. Roosevelt faced off against Republican nominee Alf Landon in 1936 presidential elections. It was a bloodbath for the Republican Party. FDR won a larger chunk of the popular vote than any president since 1820 and 98.5% of electoral votes, the most ever except Ronald Reagan in 1984.
These standout landslide victories by the two icons of liberalism and conservatism respectively were earned by radical economic reforms that rescued the economy from the blunders of previous administrations.
Reagan’s policies turned the economy around after welfare state and war spending combined with oil shocks and post-gold-standard monetary chaos produced The Great Inflation of 1973 to 1980. FDR’s landslide victory followed the success of New Deal policies that resurrected an economy devastated by Republican Herbert Hoover’s industry and jobs destroying deflationary economic pogrom. FDR won big by creating a government financed inflationary boom out of a deflationary bust using dollar devaluation and deficit spending as his main policy tools. Reagan prevailed by turning an inflationary crisis into the greatest economic expansion in modern history with blunt monetary policy as the primary instrument of reform.
It is said that today's election is about the economy, but all elections are about the economy.
Voters want to work and be left alone to live life with their families as they wish, with a minimum of interference from church and state, with the state providing security and protecting property rights. That simple, basic desire is the basis of the concept of liberalism as the term was coined across the pond two centuries ago, roughly translating into libertarianism in the U.S. today.
The 2012 presidential election bears a striking resemblance to 1936 election. Both followed on the heals of economic crisis precipitated by a credit bubble and bust.
The 1927 to 1929 debt-leveraged equity bubble crashed and brought down the banking system and economy from 1930 to 1933. Subsequent deranged economic and monetary policy decisions caused The Great Depression.
The 2002 to 2006 housing bubble crashed and also brought down the banking system and economy, but monetary and fiscal policy actions were swift and less constrained than in the 1930s as were the tools available and the philosophy that guided their use.
Although the U.S. did not get a second Great Depression after the 2008 crisis our economy remains mired in an economic depression; mild compared to the 1930s, but a depression nonetheless.
If the Obama administration’s economic policies were seen by voters as a clear-cut win today as FDR’s were by 1936 and Reagan’s were by 1984, the outcome of today's election will be easy to predict: landslide for Obama.
But this is where the 1936 and 2012 election analogy ends. This election is about the half-success of half-measures taken by the Obama administration to get the economic growth back to potential, to meet the expectations of millions of voters who turn out at the polls tomorrow wondering where the jobs are and why the economy, while better than four years ago, still feels bad.
Obama is no Ronald Reagan nor FDR, either
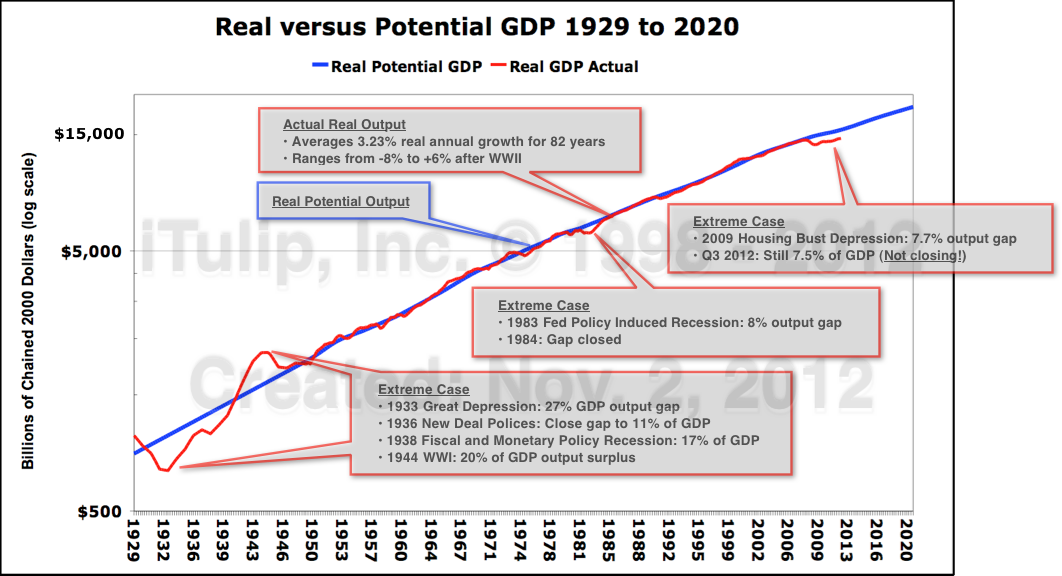
To sum up the failure of the Obama administration policies to produce a sustained recovery, here it is in one chart followed by a video to walk you through it. It shows the performance of the U.S. economy compared to potential from 1929 to date.
Key Concept: Economic Depression = Major Recession + Extended Output Gap
A recession is a period of economic contraction. The economy stops growing and actually shrinks. GDP growth instead of positive turns negative as firms lay off workers and consumers reduce purchases of goods and services. After the economy stops shrinking and the recession ends, the economy it is left with an output gap. An output gap is the difference between the size of the economy after a recession and the size that the economy would have been if the recession had not occurred and, instead, the rate of economic growth had continued. We don’t use the term “Great Recession” on iTulip because the term is confusing. The last recession started at the end of 2007 and ended in early 2009. Since then the economy has been stuck in an output gap. The period of recession plus the period of an output gap if it lasts longer than a year is called a depression. The Great Depression, for example, was composed of three years of recession from 1930 to 1933 plus seven years of output gap from 1933 to 1940 for a total length of 10 years. The current depression has lasted five years so far with 1.5 years of recession plus 3.5 of output gap. We refer to the current depression as the Housing Bust Depression.
Over the past 82 years, U.S. economic growth averaged 3.23% per year. Most recessions over that period produced small output gaps that closed within two years or less, such as in 1990. The large recessions of the early 1980s that produced an unusually large 8% of GDP output gap in 1983 closed in one year. But that recession was induced by monetary policy to halt an inflation spiral; ending the recession was a matter of removing restrictive monetary policy. The two great unintended recessions launched The Great Depression and the current Housing Bust Depression. Both followed the collapse of credit bubbles.
For all of the criticism that FDR took for the constitutionality of New Deal policies, from the standpoint of closing the output gap created by the 1930 to 1933 recession the policies worked. New Deal spending programs combined with dollar devaluation closed the output gap from 27% of GDP to 11% of GDP in three years.
Then came the 1936 elections and with them pressure from the Republican Party to reduce deficit spending. Between 1936 and 1938 the budget deficit was closed from -4% of GDP to 0%, that is, balanced. In addition, the Treasury Department, fearing inflation, embarked on an ill-fated experiment to sterilize inflows of gold. Gold inflows were segregated into separate accounts where they could not be used as reserves and become part of the money supply.
The result of these two measures was a recession within the depression that re-opened the output gap from 11% of GDP to 18%.
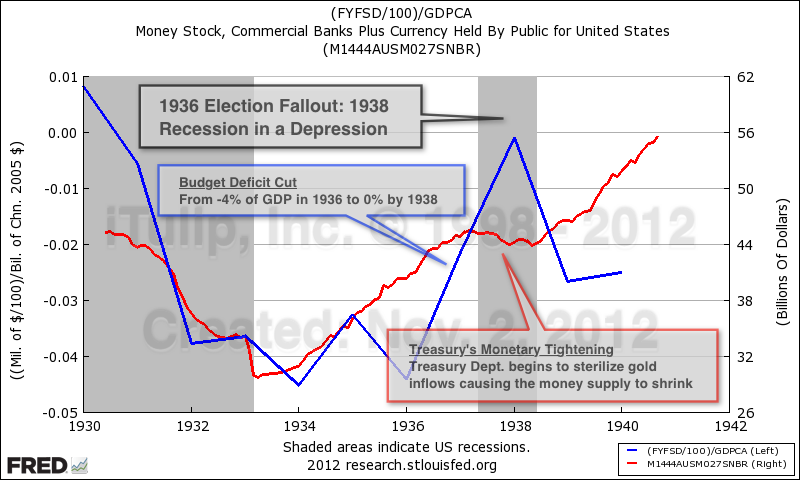
A Democratic administration withdrew economic stimulus while the economy was still in an output gap.
Result: new recession. Will history repeat?
Both policies were quickly reversed after the election and the economy began to grow again. Then WWII started. For the U.S. it was a larger public works project than FDR ever conceived. The budget deficits generated by war spending were ten times larger than those created by New Deal spending, $47 billion in 1944 versus $4.3 billion in 1936.
Americans were distinctly better off at the end of 1936 than in 1932 when FDR was elected.
It’s Always the Economy, Stupid
All elections are about the economy. If the economy improves during the incumbent’s administration then the incumbent wins a second term. If not the challenger wins.
What makes this election so close is that the economy is better than four years ago but still operating well below potential. The job market is still awful. Unlike 1933 to 1936 when unemployment fell dramatically from 25% to 15%, a 40% improvement, unemployment has only improved modestly from 2008 to 2012, from 10% to 8%, for a 20% improvement.
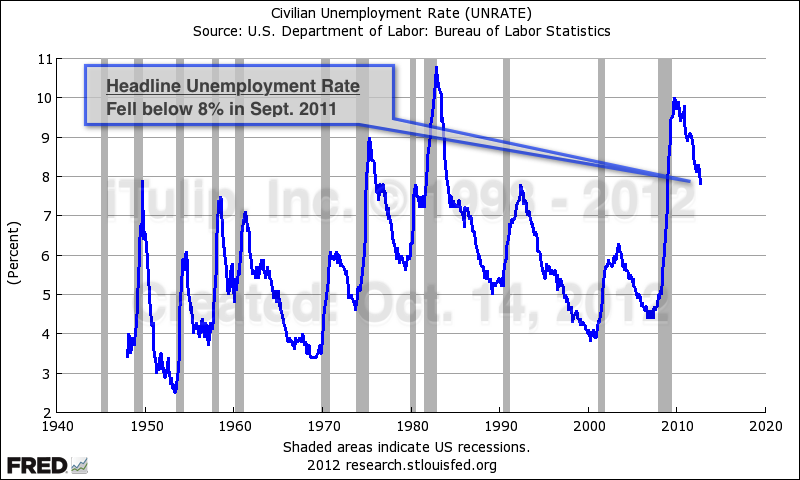
The Obama administration heralded the most recent Bureau of Labor Statistics announcement of a decline in the headline unemployment rate below 8% as proof of economic policy success. Jack Welsh famously impugned the BLS in a tweet. But there is nothing wrong with the data that shows a steady decline in civilian unemployment. But these employment data are irrelevant in the case of a persistent output gap.
Specifically, it’s the Output Gap, Stupid
A persistent output gap is caused when business are not hiring because demand is not picking up as usual during a recovery. The unemployment statistic that matters is long-term unemployment.
High long-term unemployment is the cost of the failure to close an output gap.
Under the American system, a new administration has four years to get it right. If not, voters will take their chances with new leadership.
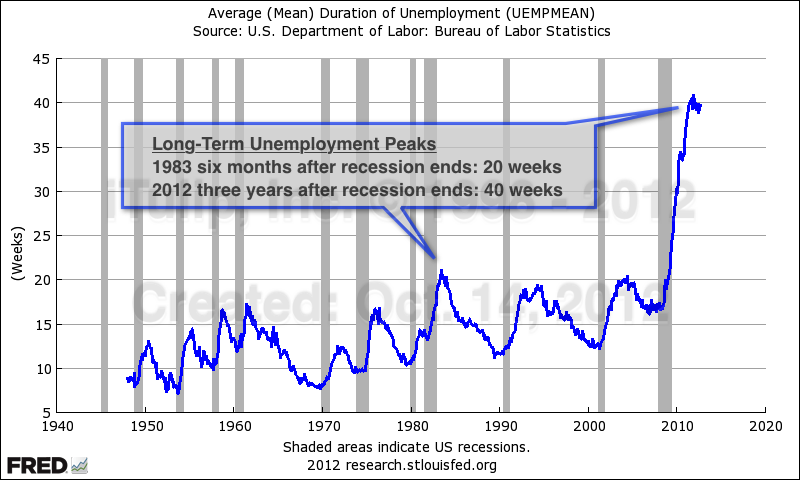
Reagan also succeeded in closing a large output gap before his first term was up. The average duration of unemployment in the early years of the Reagan administration peaked at 20 weeks in the months after the recession ended in 1983. It was clear by the end of 1984 that Reagan’s economic policies were working. But more than three years after the end of the last recession the average duration of unemployment is twice that level: 40 weeks. In a technology driven economy where workers’ skills can become obsolete in months, these workers are effectively shut out of the industries where they built their careers. The refrain of companies today is that they don't want to hire anyone who is not already employed. Losing a high paying, professional job when an economy is stuck in an output gap is like being thrown off the back of a ferry with a life preserver. With unemployment insurance you’re not going to drown, but by the time you paddle back to shore wet and disheveled no one wants to hire you. The amount of time that an unemployed person remains out of work has risen to an astonishing level.
Is small business hiring really the problem?
Both candidates profess the importance of small business for generating jobs in a recovery. Pledging allegiance to small business is motherhood and apple pie. But the data say problems in the labor market are elsewhere.
Let’s look at the relative contribution of large, medium, and small companies to total payroll employment before, during, and after the last recession.
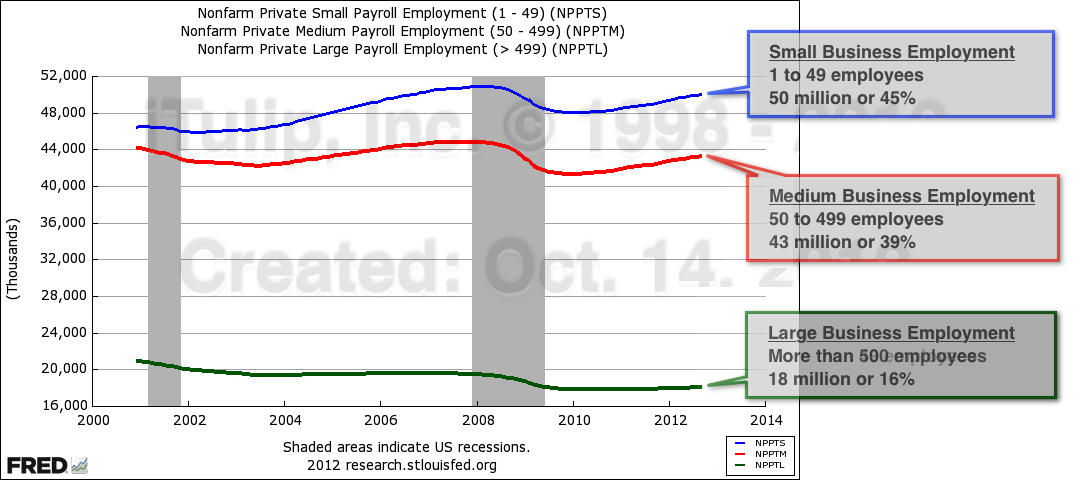
The conception that small business is the largest employer is accurate, but medium businesses are nearly as significant; small businesses provide 45% of all jobs, medium businesses 39%, and large businesses 16%.
The trends in lay-offs and re-hiring in each of these three business size categories tells us that the structure of our economy has changed since the U.S. labor market peaked in the year 2000 when the labor force participation rate hit 67%. It’s been falling ever since.
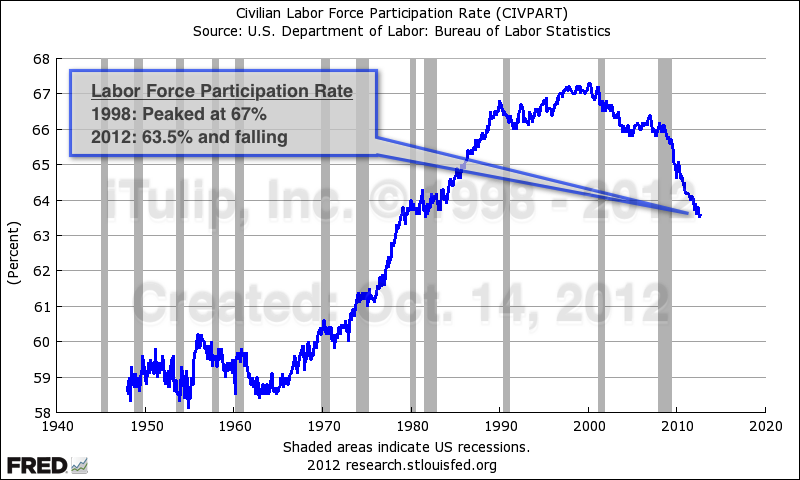
Since 2000 fewer people who can work do work.
These charts reveal changes in the contribution of large, medium, and small business to total employment between 2000 and 2012, the latest available data.
BigCo: doing more and more with fewer and fewer employees.
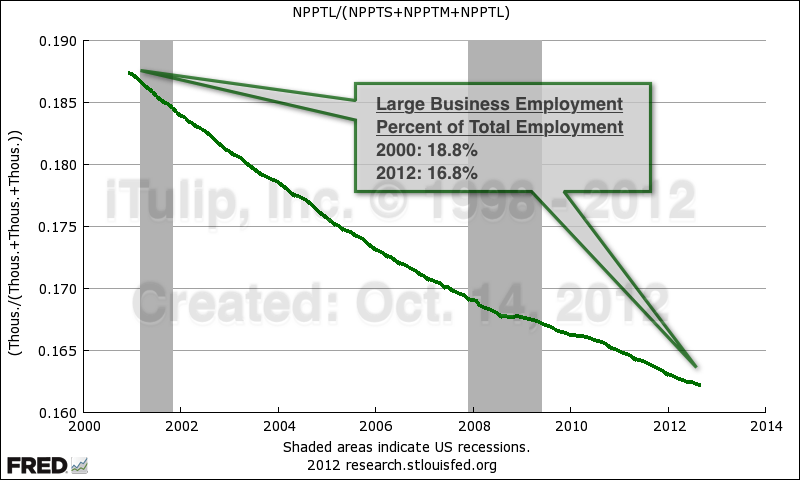
While large companies with more than 500 employees now employ approximately 17% of all workers, that’s down from 19% from ten years ago. The proportion has been dropping steadily since 2000 when the data were first collected. Big firms take advantage of technology and use offshoring and other techniques to improve labor productivity. That spells fewer workers per dollar of revenue for higher profits. The trend barely budged during the past two recessions.

MediumCo: Some efficiencies but a larger player in the recovery than BigCo.
Medium-sized companies that employ between 50 and 499 employees have also been getting more efficient over the years and took the largest hit of the three categories during the recession. But employment by medium-size companies as a portion of all employment has recovered to pre-recession level and is now a larger portion of total employment than the pre-crisis trend.
SmallCo: A growing share of employment as LargeCo downsizes.
Small businesses that employ between 1 and 49 persons have steadily gained as a supplier of jobs in the economy. Large and medium companies laid-off more employees during the recession than small businesses did. As the medium and large businesses began to hire again after the recession, small-business employment as a portion of the total leveled off. While the contribution of large companies to total employment fell since 2000, small business has grown.
The popular concept is that small business provides jobs during recoveries. In fact small businesses keep jobs during a recovery and medium-sized businesses that provide the new jobs that drive a recovery. If we dig deeper into the data we can see why. The following charts show the number of firms by firm size from 2000 to 2009, the latest data available.
SmallCo Details: All of the growth in the number of firms is in the smallest firms.
By breaking up each category into component parts we can see that growth in the contribution of employment by small companies is entirely in one-to-four employee firms. Nearly 890,000 of these firms were added from 2000 to 2009, and increase of 33%. This is largely the self-employment trend that companies like Staples latched onto. Professionals where were laid-off from large and medium companies and could not find a new job or retire started consulting and other professional services companies, went into real estate, or otherwise built new careers in self-employment. I wonder how many of these people are really "employed" in the sense of making a meaningful income, or are hanging out a shingle to avoid the stigma of unemployment. An increase of 890,000 firms added approximately 1.8 million new "jobs."
MidCo Details: A modest decrease in the number of firms.
The number of medium-sized companies actually shrank by 4% over the same period, shedding 21,000 firms over the period shrinking payrolls by approximately 840,000.
LargeCo Details: Small growth but the law of big numbers applies.
The addition of 365 firms that employ an average of 3,326 employees expanded payrolls by approximately 1.2 million between 2000 and 2009.
The impact on incomes caused by the shift is dramatic. The chart below shows the change in the average payroll per employee by firm size.
More SmallCo jobs means more lower paying jobs.
The spread between pay for work at small business versus large grew dramatically between 2000 and 2009. If you worked for a smal company in 2000 your salary was on average 16% less than your large company counterpart. By 2009 that difference widened to 34%. Large companies are paying fewer people more to do more rather than expand payrolls.
All businesses took a hit during the recession but large companies had the largest impact on unemployment.
All together firms decreased payrolls by 4.2 million employees during the recession. Small businesses hired back 1.2 million and added 200,000 since. Most of the 1.7 million laid-off by medium businesses have been rehired but for 200,000 that either remain unemployed or were hired by small companies or formed small businesses. Big companies cut 982,000 during the recession and have hired back only 242,000. Of the 940,000 who lost their jobs during the recession and have not been rehired, 760,000 of them once worked for a company with more than 500 employees. These are the unemployed that make up that staggering 40-week average duration of unemployment statistic.
In sum, from 2000 when the tech bubble went bust to 2009, the year the last recession ended, the structure of the job market with respect to firm size changed by bulging at either end and shrinking in the middle. A review of the birth-death data shows that tiny firms multiplied, a few hundred medium companies became big, and fewer medium companies were created than went out of business. After the recession big firms that had become a key source of payroll employment over the previous decade by adding more firms with a high average headcount didn't re-hire them after layoffs during the recession. I expect that when the SBA data are updated we will see that the collapse of the housing bubble and the recession that followed produced a second surge in number of new tiny companies as occurred after the collapse of the tech bubble.
The campaign rhetoric is about small business jobs. Seems to me, though, that we don't have a small business formation and hiring problem but a medium business formation problem and a large business payroll employment problem. Before attempting any remedies to cure our economic ills I'd advise the candidates to work harder to understand the problem. Instead I expect tax, healthcare, regulation, and other public policy matters related to the labor market to be decided in favor of special interests, in particular the FIRE sector, although the real estate sector does appear to be losing steam in Washington. Personally I think it will be a huge boom to businesses of all sizes in the U.S. to get corporations out of the business of paying for employee's healthcare. But the I in FIRE is going strong and the grossly inefficient single-payer system managed by insurance companies will persist. In fact either Obamacare of Romneycare writ large will cement it in place.
Reality Check, Election Edition – Part II: America's Future Energy Isolationism ($ubscription)

A home on Martha’s Vineyard sits precariously close to a cliff moved back by Hurricane Sandy (Photo credit: Eric Janszen)
The flawed framework of the election debate is bigger than a misconstrued labor market problem. The greatest risks to the economy going forward are either framed in fallacies or are not discussed at all. We call them the Elephants in America's Parlor.
Elephants in America's Parlor
• Housing Bubble: The gift that keeps on taking
• US Treasury bond in extremis: Set-up for disaster
• ZIRP Purgatory
• Post-Bubble Deficit Trap
• Energy Isolationism
Housing Bubble: the gift that keeps on taking
The first is the housing bubble. I warned about the long-term macroeconomic consequences of the housing bubble in 2002. Housing is a critical component of the U.S. economy since WWII and has led every recovery since the early 1980s. Permitting a housing bubble to develop and in fact encouraging it via regulatory and monetary policy is an inexcusable act of fiduciary malfeasance by Bush administration.
The housing bubble: An epic and unrecoverable error.
The smooth solid line in the chart above is the price of housing since 1890. Before the 1995 to 2006 housing bubble two minor bubbles occurred in the late 1970s and again in the late 1980s. The housing market stopped collapsing in 2009, thanks to the Fed and Congress throwing everything and the kitchen sink at it for three years.
The jagged solid like after 2009 is the choppy managed price decline after the government slowed then controlled the decline by subsidizing 90% of all mortgages in the secondary market via two nationalized mortgage lenders and purchases of mortgage securities and Treasury bonds by the Fed. For this reason I refer to the post-bubble U.S. real estate market as the world’s largest public housing project. As I explained two weeks ago in a panel discussion with the Vice Chairman of the Mortgage Banker's Association and Economics Director of Fannie Mae, between the stimulus that created the housing bubble and the government programs that have mitigated the housing bubble collapse since 2009, there hasn't been a market price for housing in the U.S. since 1995.
The blame falls squarely on the shoulders of the Republican president and Republican dominated Congress who presided over this epic disaster for the U.S. economy.
Preventing a second Great Depression demanded zero interest rate policy and historic deficit spending, resulting in gigantic public debt and large scale Treasury bond price fixing. This leads to the second Elephant.
US Treasury bond in extremis: set-up for disaster
The second issue never discussed by either candidate is the extreme measures taken to hold down interest rates by creating an artificial shortage of over-issued bonds.
Bond prices as readers know move in the opposite direction of yields. The reason is complicated and unintuitive. I won’t go into the details here. You cannot directly derive a bond price from a yield but by dividing 1 by the yield of a bond of a certain type and duration you can see the historical change in price over time. Think of it as a relative bond price index.
Relative long-term U.S. government bond price since 1856. What could possibly go wrong?
How can this not be a hot topic for public debate?
The way I see it the price of long-term U.S. government bonds is default and inflation risk sea level for global securities markets.
Using the chart above, you could say sea level has ranged from a high of 5 feet to just under 1 feet for the 120 year period from 1856 to 1976. The sharpest rise was from 2.2 to 5 over ten years from 1930 to 1940. But after rising from 1 to 3 feet over 25 years from 1983 to 2008, sea level was pumped from 3 to 6.5 feet in 3 years. I think this ends in a U.S. bond and currency crisis, but no telling when.
The third elephant in the parlor is fiscal deficits and accumulating debt as the inevitable result of the previous decade of asset bubbles. (more... $ubscription)
iTulip Select: The Investment Thesis for the Next Cycle™
__________________________________________________
To receive the iTulip Newsletter or iTulip Alerts, Join our FREE Email Mailing List
Copyright © iTulip, Inc. 1998 - 2012 All Rights Reserved
All information provided "as is" for informational purposes only, not intended for trading purposes or advice. Nothing appearing on this website should be considered a recommendation to buy or to sell any security or related financial instrument. iTulip, Inc. is not liable for any informational errors, incompleteness, or delays, or for any actions taken in reliance on information contained herein. Full Disclaimer
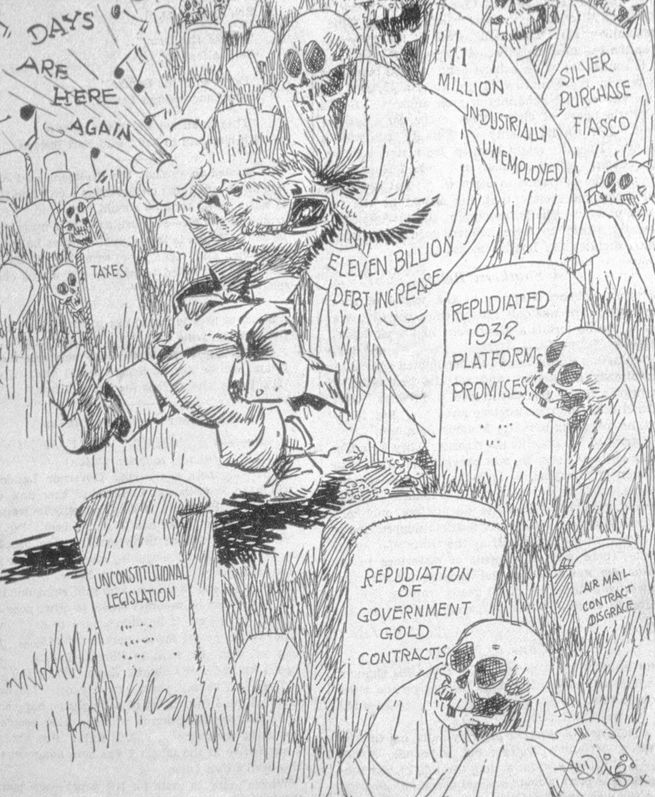
• 1936 political cartoon depicts the Democratic Party whistling past a graveyard of tombstones
carved with themes echoed by the Republican Party in the 2012 election.
• $11 billion debt increase due to New Deal policies is today $183 billion adjusted for 66 years of inflation.
• Actual debt increase during President Obama's first term: $6 trillion or $360 billion in 1936 dollars.
• 1936 unemployment rate 15%, down from a 1933 peak of 25% versus 8% today from a peak of 10% in 2010.
Six years into the decade that came to be known as The Great Depression incumbent Franklin D. Roosevelt faced off against Republican nominee Alf Landon in 1936 presidential elections. It was a bloodbath for the Republican Party. FDR won a larger chunk of the popular vote than any president since 1820 and 98.5% of electoral votes, the most ever except Ronald Reagan in 1984.
These standout landslide victories by the two icons of liberalism and conservatism respectively were earned by radical economic reforms that rescued the economy from the blunders of previous administrations.
Reagan’s policies turned the economy around after welfare state and war spending combined with oil shocks and post-gold-standard monetary chaos produced The Great Inflation of 1973 to 1980. FDR’s landslide victory followed the success of New Deal policies that resurrected an economy devastated by Republican Herbert Hoover’s industry and jobs destroying deflationary economic pogrom. FDR won big by creating a government financed inflationary boom out of a deflationary bust using dollar devaluation and deficit spending as his main policy tools. Reagan prevailed by turning an inflationary crisis into the greatest economic expansion in modern history with blunt monetary policy as the primary instrument of reform.
It is said that today's election is about the economy, but all elections are about the economy.
Voters want to work and be left alone to live life with their families as they wish, with a minimum of interference from church and state, with the state providing security and protecting property rights. That simple, basic desire is the basis of the concept of liberalism as the term was coined across the pond two centuries ago, roughly translating into libertarianism in the U.S. today.
The 2012 presidential election bears a striking resemblance to 1936 election. Both followed on the heals of economic crisis precipitated by a credit bubble and bust.
The 1927 to 1929 debt-leveraged equity bubble crashed and brought down the banking system and economy from 1930 to 1933. Subsequent deranged economic and monetary policy decisions caused The Great Depression.
The 2002 to 2006 housing bubble crashed and also brought down the banking system and economy, but monetary and fiscal policy actions were swift and less constrained than in the 1930s as were the tools available and the philosophy that guided their use.
Although the U.S. did not get a second Great Depression after the 2008 crisis our economy remains mired in an economic depression; mild compared to the 1930s, but a depression nonetheless.
If the Obama administration’s economic policies were seen by voters as a clear-cut win today as FDR’s were by 1936 and Reagan’s were by 1984, the outcome of today's election will be easy to predict: landslide for Obama.
But this is where the 1936 and 2012 election analogy ends. This election is about the half-success of half-measures taken by the Obama administration to get the economic growth back to potential, to meet the expectations of millions of voters who turn out at the polls tomorrow wondering where the jobs are and why the economy, while better than four years ago, still feels bad.
Obama is no Ronald Reagan nor FDR, either
To sum up the failure of the Obama administration policies to produce a sustained recovery, here it is in one chart followed by a video to walk you through it. It shows the performance of the U.S. economy compared to potential from 1929 to date.
Key Concept: Economic Depression = Major Recession + Extended Output Gap
A recession is a period of economic contraction. The economy stops growing and actually shrinks. GDP growth instead of positive turns negative as firms lay off workers and consumers reduce purchases of goods and services. After the economy stops shrinking and the recession ends, the economy it is left with an output gap. An output gap is the difference between the size of the economy after a recession and the size that the economy would have been if the recession had not occurred and, instead, the rate of economic growth had continued. We don’t use the term “Great Recession” on iTulip because the term is confusing. The last recession started at the end of 2007 and ended in early 2009. Since then the economy has been stuck in an output gap. The period of recession plus the period of an output gap if it lasts longer than a year is called a depression. The Great Depression, for example, was composed of three years of recession from 1930 to 1933 plus seven years of output gap from 1933 to 1940 for a total length of 10 years. The current depression has lasted five years so far with 1.5 years of recession plus 3.5 of output gap. We refer to the current depression as the Housing Bust Depression.
Over the past 82 years, U.S. economic growth averaged 3.23% per year. Most recessions over that period produced small output gaps that closed within two years or less, such as in 1990. The large recessions of the early 1980s that produced an unusually large 8% of GDP output gap in 1983 closed in one year. But that recession was induced by monetary policy to halt an inflation spiral; ending the recession was a matter of removing restrictive monetary policy. The two great unintended recessions launched The Great Depression and the current Housing Bust Depression. Both followed the collapse of credit bubbles.
For all of the criticism that FDR took for the constitutionality of New Deal policies, from the standpoint of closing the output gap created by the 1930 to 1933 recession the policies worked. New Deal spending programs combined with dollar devaluation closed the output gap from 27% of GDP to 11% of GDP in three years.
Then came the 1936 elections and with them pressure from the Republican Party to reduce deficit spending. Between 1936 and 1938 the budget deficit was closed from -4% of GDP to 0%, that is, balanced. In addition, the Treasury Department, fearing inflation, embarked on an ill-fated experiment to sterilize inflows of gold. Gold inflows were segregated into separate accounts where they could not be used as reserves and become part of the money supply.
The result of these two measures was a recession within the depression that re-opened the output gap from 11% of GDP to 18%.
A Democratic administration withdrew economic stimulus while the economy was still in an output gap.
Result: new recession. Will history repeat?
Both policies were quickly reversed after the election and the economy began to grow again. Then WWII started. For the U.S. it was a larger public works project than FDR ever conceived. The budget deficits generated by war spending were ten times larger than those created by New Deal spending, $47 billion in 1944 versus $4.3 billion in 1936.
Americans were distinctly better off at the end of 1936 than in 1932 when FDR was elected.
It’s Always the Economy, Stupid
All elections are about the economy. If the economy improves during the incumbent’s administration then the incumbent wins a second term. If not the challenger wins.
What makes this election so close is that the economy is better than four years ago but still operating well below potential. The job market is still awful. Unlike 1933 to 1936 when unemployment fell dramatically from 25% to 15%, a 40% improvement, unemployment has only improved modestly from 2008 to 2012, from 10% to 8%, for a 20% improvement.
The Obama administration heralded the most recent Bureau of Labor Statistics announcement of a decline in the headline unemployment rate below 8% as proof of economic policy success. Jack Welsh famously impugned the BLS in a tweet. But there is nothing wrong with the data that shows a steady decline in civilian unemployment. But these employment data are irrelevant in the case of a persistent output gap.
Specifically, it’s the Output Gap, Stupid
A persistent output gap is caused when business are not hiring because demand is not picking up as usual during a recovery. The unemployment statistic that matters is long-term unemployment.
High long-term unemployment is the cost of the failure to close an output gap.
Under the American system, a new administration has four years to get it right. If not, voters will take their chances with new leadership.
Reagan also succeeded in closing a large output gap before his first term was up. The average duration of unemployment in the early years of the Reagan administration peaked at 20 weeks in the months after the recession ended in 1983. It was clear by the end of 1984 that Reagan’s economic policies were working. But more than three years after the end of the last recession the average duration of unemployment is twice that level: 40 weeks. In a technology driven economy where workers’ skills can become obsolete in months, these workers are effectively shut out of the industries where they built their careers. The refrain of companies today is that they don't want to hire anyone who is not already employed. Losing a high paying, professional job when an economy is stuck in an output gap is like being thrown off the back of a ferry with a life preserver. With unemployment insurance you’re not going to drown, but by the time you paddle back to shore wet and disheveled no one wants to hire you. The amount of time that an unemployed person remains out of work has risen to an astonishing level.
Is small business hiring really the problem?
Both candidates profess the importance of small business for generating jobs in a recovery. Pledging allegiance to small business is motherhood and apple pie. But the data say problems in the labor market are elsewhere.
Let’s look at the relative contribution of large, medium, and small companies to total payroll employment before, during, and after the last recession.
The conception that small business is the largest employer is accurate, but medium businesses are nearly as significant; small businesses provide 45% of all jobs, medium businesses 39%, and large businesses 16%.
The trends in lay-offs and re-hiring in each of these three business size categories tells us that the structure of our economy has changed since the U.S. labor market peaked in the year 2000 when the labor force participation rate hit 67%. It’s been falling ever since.
Since 2000 fewer people who can work do work.
These charts reveal changes in the contribution of large, medium, and small business to total employment between 2000 and 2012, the latest available data.
BigCo: doing more and more with fewer and fewer employees.
While large companies with more than 500 employees now employ approximately 17% of all workers, that’s down from 19% from ten years ago. The proportion has been dropping steadily since 2000 when the data were first collected. Big firms take advantage of technology and use offshoring and other techniques to improve labor productivity. That spells fewer workers per dollar of revenue for higher profits. The trend barely budged during the past two recessions.
MediumCo: Some efficiencies but a larger player in the recovery than BigCo.
Medium-sized companies that employ between 50 and 499 employees have also been getting more efficient over the years and took the largest hit of the three categories during the recession. But employment by medium-size companies as a portion of all employment has recovered to pre-recession level and is now a larger portion of total employment than the pre-crisis trend.
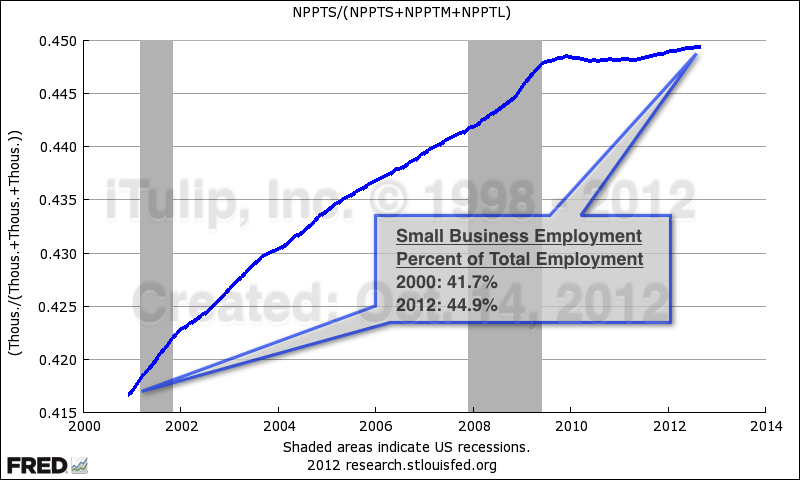
SmallCo: A growing share of employment as LargeCo downsizes.
Small businesses that employ between 1 and 49 persons have steadily gained as a supplier of jobs in the economy. Large and medium companies laid-off more employees during the recession than small businesses did. As the medium and large businesses began to hire again after the recession, small-business employment as a portion of the total leveled off. While the contribution of large companies to total employment fell since 2000, small business has grown.
The popular concept is that small business provides jobs during recoveries. In fact small businesses keep jobs during a recovery and medium-sized businesses that provide the new jobs that drive a recovery. If we dig deeper into the data we can see why. The following charts show the number of firms by firm size from 2000 to 2009, the latest data available.
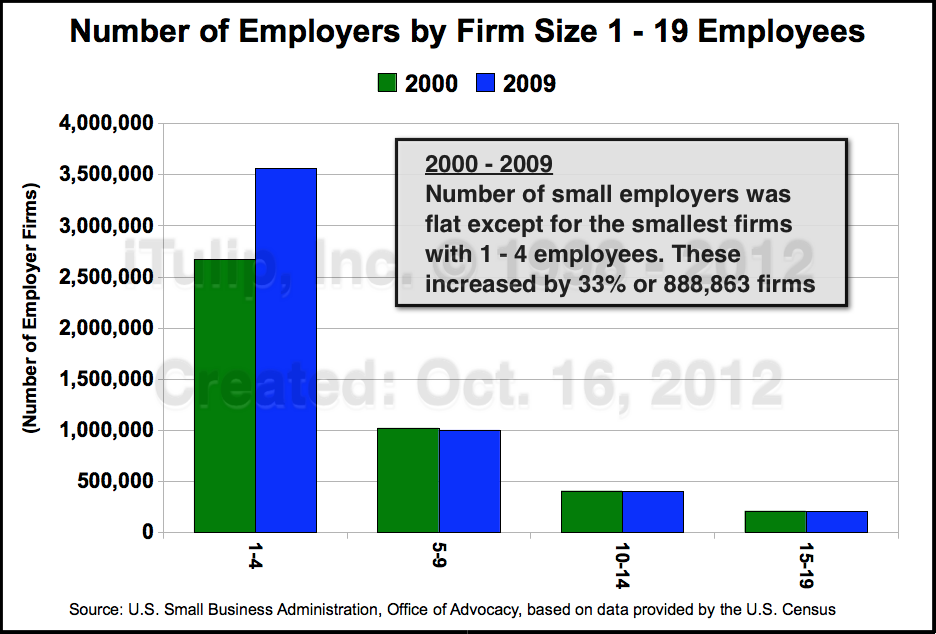
SmallCo Details: All of the growth in the number of firms is in the smallest firms.
By breaking up each category into component parts we can see that growth in the contribution of employment by small companies is entirely in one-to-four employee firms. Nearly 890,000 of these firms were added from 2000 to 2009, and increase of 33%. This is largely the self-employment trend that companies like Staples latched onto. Professionals where were laid-off from large and medium companies and could not find a new job or retire started consulting and other professional services companies, went into real estate, or otherwise built new careers in self-employment. I wonder how many of these people are really "employed" in the sense of making a meaningful income, or are hanging out a shingle to avoid the stigma of unemployment. An increase of 890,000 firms added approximately 1.8 million new "jobs."
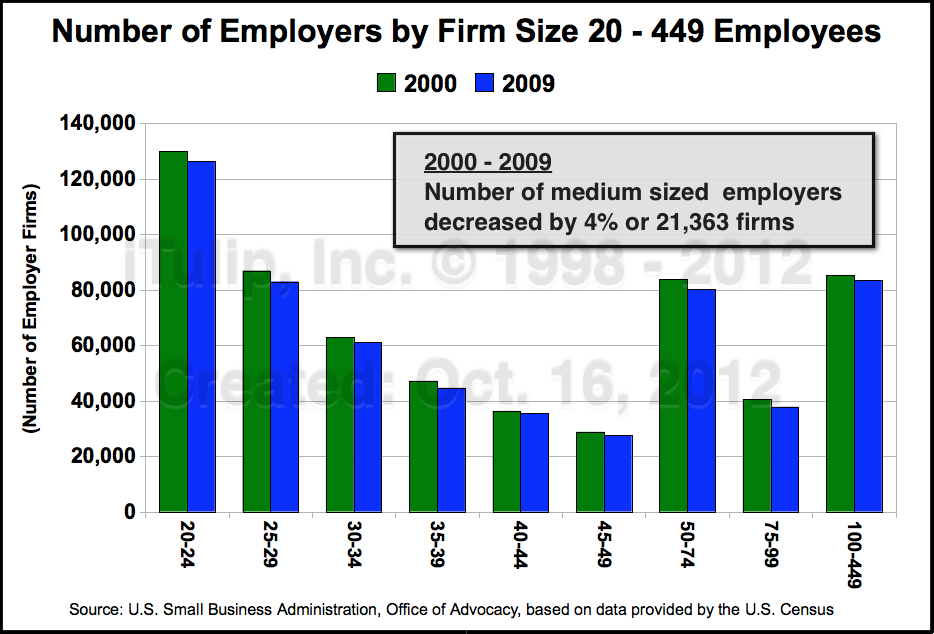
MidCo Details: A modest decrease in the number of firms.
The number of medium-sized companies actually shrank by 4% over the same period, shedding 21,000 firms over the period shrinking payrolls by approximately 840,000.
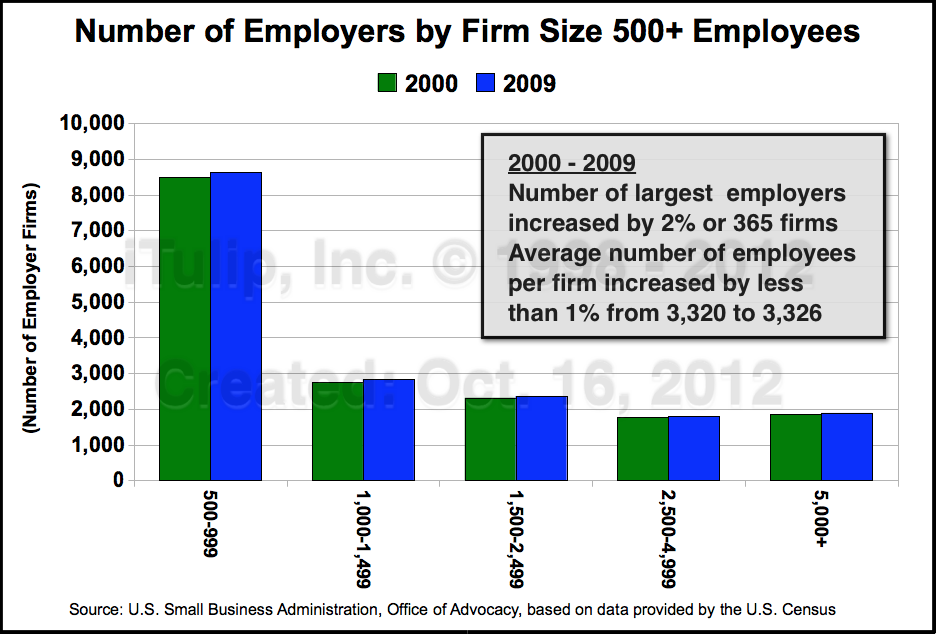
LargeCo Details: Small growth but the law of big numbers applies.
The addition of 365 firms that employ an average of 3,326 employees expanded payrolls by approximately 1.2 million between 2000 and 2009.
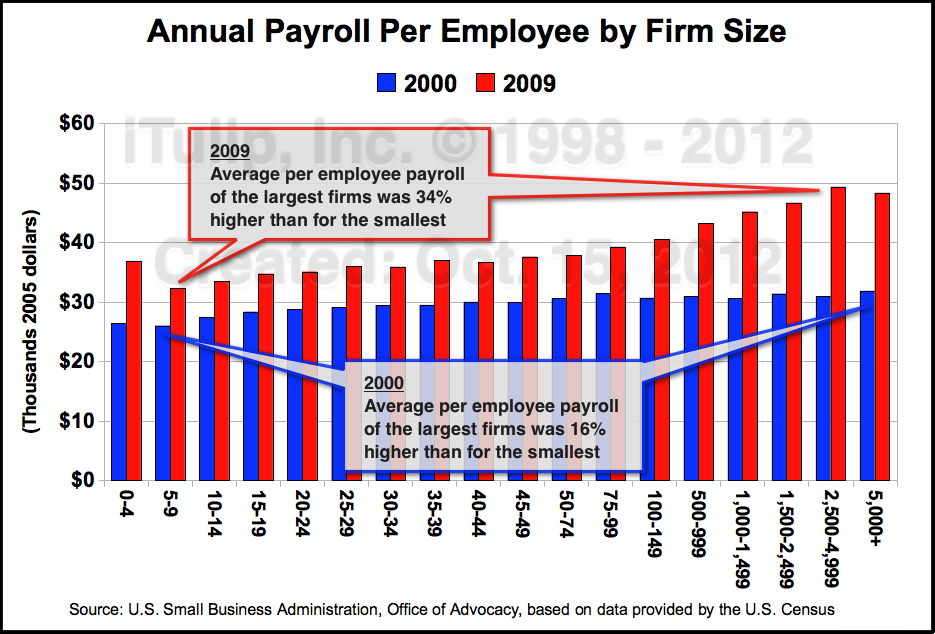
The impact on incomes caused by the shift is dramatic. The chart below shows the change in the average payroll per employee by firm size.
More SmallCo jobs means more lower paying jobs.
The spread between pay for work at small business versus large grew dramatically between 2000 and 2009. If you worked for a smal company in 2000 your salary was on average 16% less than your large company counterpart. By 2009 that difference widened to 34%. Large companies are paying fewer people more to do more rather than expand payrolls.
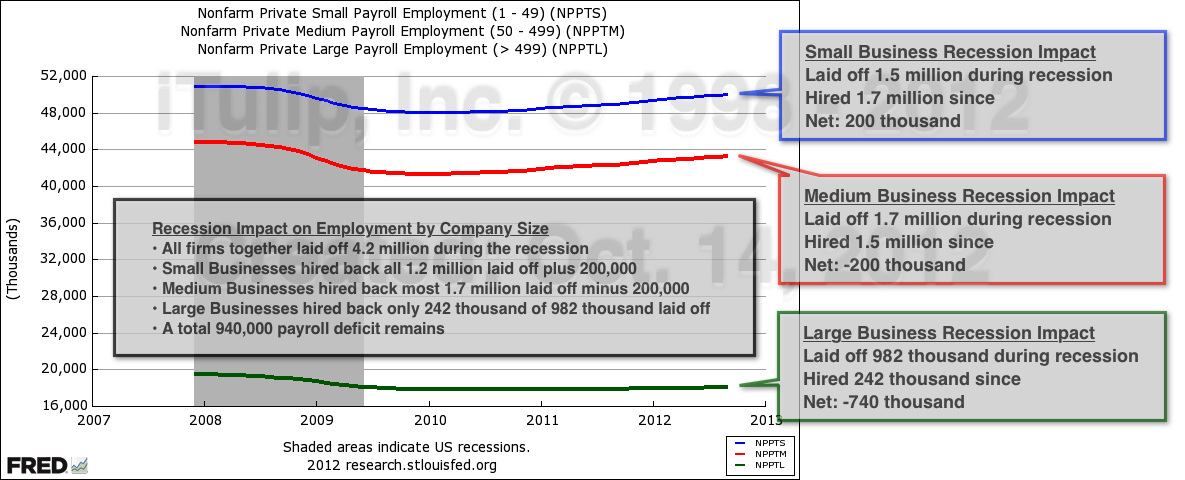
All businesses took a hit during the recession but large companies had the largest impact on unemployment.
All together firms decreased payrolls by 4.2 million employees during the recession. Small businesses hired back 1.2 million and added 200,000 since. Most of the 1.7 million laid-off by medium businesses have been rehired but for 200,000 that either remain unemployed or were hired by small companies or formed small businesses. Big companies cut 982,000 during the recession and have hired back only 242,000. Of the 940,000 who lost their jobs during the recession and have not been rehired, 760,000 of them once worked for a company with more than 500 employees. These are the unemployed that make up that staggering 40-week average duration of unemployment statistic.
In sum, from 2000 when the tech bubble went bust to 2009, the year the last recession ended, the structure of the job market with respect to firm size changed by bulging at either end and shrinking in the middle. A review of the birth-death data shows that tiny firms multiplied, a few hundred medium companies became big, and fewer medium companies were created than went out of business. After the recession big firms that had become a key source of payroll employment over the previous decade by adding more firms with a high average headcount didn't re-hire them after layoffs during the recession. I expect that when the SBA data are updated we will see that the collapse of the housing bubble and the recession that followed produced a second surge in number of new tiny companies as occurred after the collapse of the tech bubble.
The campaign rhetoric is about small business jobs. Seems to me, though, that we don't have a small business formation and hiring problem but a medium business formation problem and a large business payroll employment problem. Before attempting any remedies to cure our economic ills I'd advise the candidates to work harder to understand the problem. Instead I expect tax, healthcare, regulation, and other public policy matters related to the labor market to be decided in favor of special interests, in particular the FIRE sector, although the real estate sector does appear to be losing steam in Washington. Personally I think it will be a huge boom to businesses of all sizes in the U.S. to get corporations out of the business of paying for employee's healthcare. But the I in FIRE is going strong and the grossly inefficient single-payer system managed by insurance companies will persist. In fact either Obamacare of Romneycare writ large will cement it in place.
Reality Check, Election Edition – Part II: America's Future Energy Isolationism ($ubscription)
A home on Martha’s Vineyard sits precariously close to a cliff moved back by Hurricane Sandy (Photo credit: Eric Janszen)
The flawed framework of the election debate is bigger than a misconstrued labor market problem. The greatest risks to the economy going forward are either framed in fallacies or are not discussed at all. We call them the Elephants in America's Parlor.
Elephants in America's Parlor
• Housing Bubble: The gift that keeps on taking
• US Treasury bond in extremis: Set-up for disaster
• ZIRP Purgatory
• Post-Bubble Deficit Trap
• Energy Isolationism
Housing Bubble: the gift that keeps on taking
The first is the housing bubble. I warned about the long-term macroeconomic consequences of the housing bubble in 2002. Housing is a critical component of the U.S. economy since WWII and has led every recovery since the early 1980s. Permitting a housing bubble to develop and in fact encouraging it via regulatory and monetary policy is an inexcusable act of fiduciary malfeasance by Bush administration.
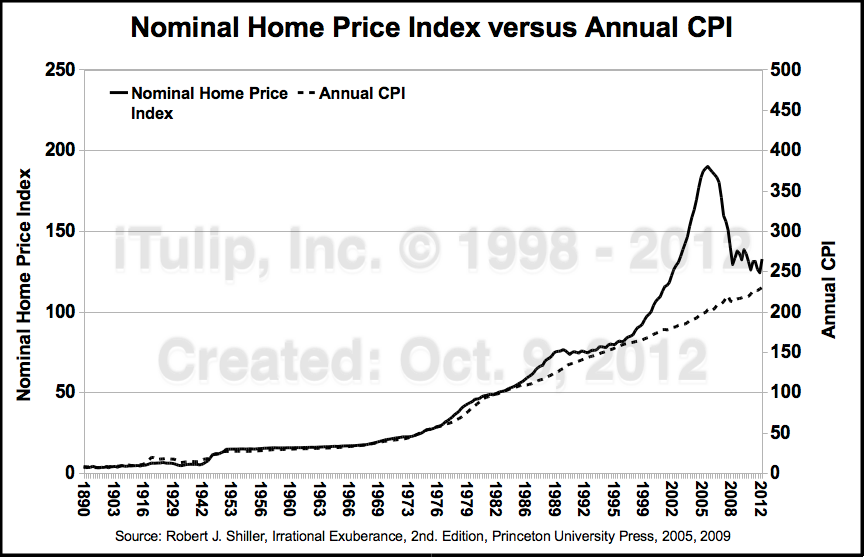
The housing bubble: An epic and unrecoverable error.
The smooth solid line in the chart above is the price of housing since 1890. Before the 1995 to 2006 housing bubble two minor bubbles occurred in the late 1970s and again in the late 1980s. The housing market stopped collapsing in 2009, thanks to the Fed and Congress throwing everything and the kitchen sink at it for three years.
The jagged solid like after 2009 is the choppy managed price decline after the government slowed then controlled the decline by subsidizing 90% of all mortgages in the secondary market via two nationalized mortgage lenders and purchases of mortgage securities and Treasury bonds by the Fed. For this reason I refer to the post-bubble U.S. real estate market as the world’s largest public housing project. As I explained two weeks ago in a panel discussion with the Vice Chairman of the Mortgage Banker's Association and Economics Director of Fannie Mae, between the stimulus that created the housing bubble and the government programs that have mitigated the housing bubble collapse since 2009, there hasn't been a market price for housing in the U.S. since 1995.
The blame falls squarely on the shoulders of the Republican president and Republican dominated Congress who presided over this epic disaster for the U.S. economy.
Preventing a second Great Depression demanded zero interest rate policy and historic deficit spending, resulting in gigantic public debt and large scale Treasury bond price fixing. This leads to the second Elephant.
US Treasury bond in extremis: set-up for disaster
The second issue never discussed by either candidate is the extreme measures taken to hold down interest rates by creating an artificial shortage of over-issued bonds.
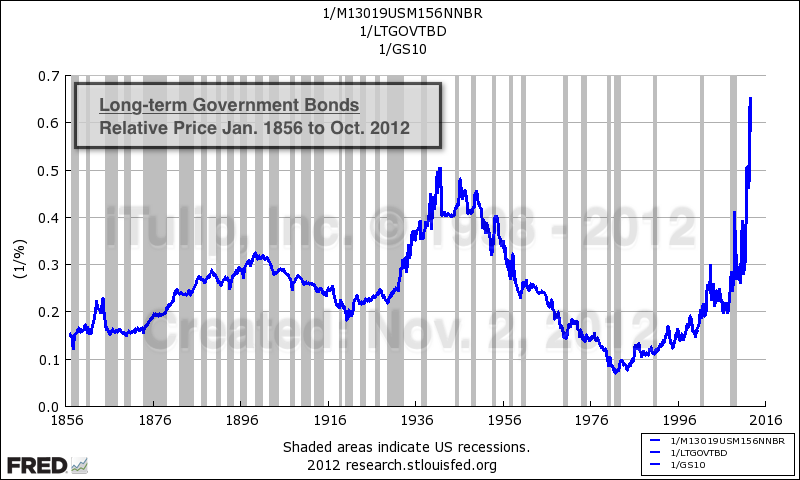
Bond prices as readers know move in the opposite direction of yields. The reason is complicated and unintuitive. I won’t go into the details here. You cannot directly derive a bond price from a yield but by dividing 1 by the yield of a bond of a certain type and duration you can see the historical change in price over time. Think of it as a relative bond price index.
Relative long-term U.S. government bond price since 1856. What could possibly go wrong?
How can this not be a hot topic for public debate?
The way I see it the price of long-term U.S. government bonds is default and inflation risk sea level for global securities markets.
Using the chart above, you could say sea level has ranged from a high of 5 feet to just under 1 feet for the 120 year period from 1856 to 1976. The sharpest rise was from 2.2 to 5 over ten years from 1930 to 1940. But after rising from 1 to 3 feet over 25 years from 1983 to 2008, sea level was pumped from 3 to 6.5 feet in 3 years. I think this ends in a U.S. bond and currency crisis, but no telling when.
The third elephant in the parlor is fiscal deficits and accumulating debt as the inevitable result of the previous decade of asset bubbles. (more... $ubscription)
iTulip Select: The Investment Thesis for the Next Cycle™
__________________________________________________
To receive the iTulip Newsletter or iTulip Alerts, Join our FREE Email Mailing List
Copyright © iTulip, Inc. 1998 - 2012 All Rights Reserved
All information provided "as is" for informational purposes only, not intended for trading purposes or advice. Nothing appearing on this website should be considered a recommendation to buy or to sell any security or related financial instrument. iTulip, Inc. is not liable for any informational errors, incompleteness, or delays, or for any actions taken in reliance on information contained herein. Full Disclaimer


Comment