 Tweet
Tweet
Ka-Poom Theory Update Two – Preamble: Theory of a Sudden Adjustment
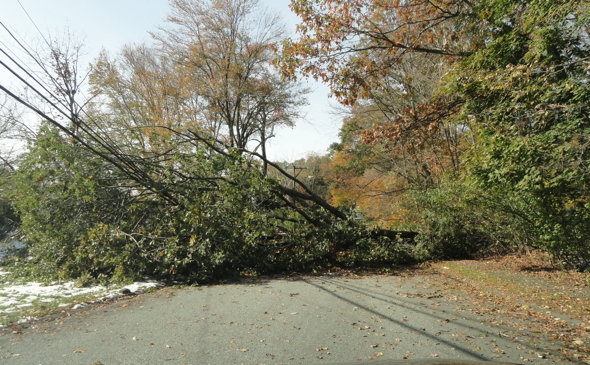
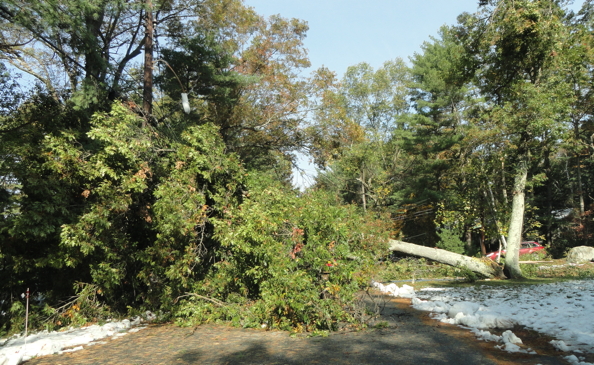
A main road near iTulip offices the day after a once in 100 years October 2011 snowstorm
knocked down trees and cut power to homes for several weeks.
CE: After reading your Ka-Poom Theory update outline… oh, boy. Huge project. Okay, we eat this elephant one bite at a time. I want to start by getting the chronology down. Readers may be either new and they don’t know the history or they are old farts like me who can’t remember. Those of us who started to read your work in 1998 think first of your tech bubble tracking start-to-bust. You famously told us to get out of stocks in March 2000. Then in 2001 you went off to run a couple of VC-backed companies. You started to track the housing bubble in 2002 while you were still doing that. Where did you find the time?
EJ: I only updated iTulip two or three times a year to note turning points in the housing bubble as it developed, such as the start in 2002 and the peak between 2005 and 2006 depending on the market segment, and to lay out my model for the rate and duration of the decline, which I determined to be 10 to 15 years from 2005, depending on the form and extent of government interference in the market's mean reversion process. I still expect a price correction to reach inflation-adjusted year 2000 price levels before the housing correction is over.
CE: You restarted iTulip full time in March 2006. You laid it all out – the coming crash of the securitized mortgage market, the global financial crisis, the mega recession, but you also said “no” to deflation and go that right, too. You were probably the first to identify the threat posed by the bubble in mortgage-backed securities. Your December 2007 timing on the stock market was epic. You said to look out for a 40% decline in the S&P500 in 2008. We got 38%. Nice. And you noted in March 2009 that the crash was over and a bounce started.
EJ: Let me interrupt you there because subsequent to all of that I was wrong about the duration of that bounce off the March 2009 lows. Except for a minor correction in April 2010 the stock market has recovered much of the loss in nominal terms.
CE: Heavy on the “nominal.”
EJ: Right, as I note in this analysis, and you saw in the outline, the S&P500 is still 31% below its March 2000 peak in inflation-adjusted terms. Of the two chances readers got to dodge the “Buy and Hold” stocks bullet, either in March 2000 and December 2007, March 2000 was the better of the two.
CE: That’s when you “sold everything” and went into 10-year Treasury bonds and cash, back when the yield on the 10-year was 6%?
EJ: 6.5%.
CE: A year later you took a 15% portfolio slug in gold at $270?
EJ: Average buy-in price was $270. And never sold it.
CE: That’s all on the record and verified. CNBC and all that. Your friends at Twin Focus Capital Partners validated your bond plus gold portfolio performance up to 2010. Okay, then in the middle of 2010 you started to fret about the Treasury bond slug of your portfolio, and look for stuff to divest into from bonds. You and some itulipers invested in Eastham Capital in 2010 based on your “rising rents” theory. How’s that doing?
EJ: Better than a 10-Year Treasury bond; over 12% cash-on-cash so far. Unfortunately it’s not something that the all of our members could invest in. The group is always looking for ways to invest in the trends we identify through our research and analysis.
CE: Then you and members put money into a start-up called TruTouch Technologies in line with your theory that tech entrepreneurs are the last great hope for the U.S. economy. How’s that going?
EJ: Too soon to say, but promising so far.
CE: I’ve always wanted to ask, you made piles of money getting out of the tech bubble at the top and shorting it, buying gold in 2001 at $270 and never selling it, shorting stocks in 2007… what do your friends and family make of you? Are they pessimistic like you?
EJ: I prefer to think of myself as a skeptical realist. On the one hand, I’m optimistic enough to invest in start-up companies like TruTouch Technologies and others, but on the other I’ve learned to listen to the data and endeavor to understand the underlying processes that drive the markets and economy. I don’t put much stock in the theories of anyone who has anything to sell, and certainly not in the policy makers who are making it up as they go along. The data telling me that we are well along in a self-limiting process that started more than 30 years ago. It’s going to be quite a shock when it ends some day.
CE: Now you’re telling us that the two big crises that defined the 2000 to 2011 period and you made your timing and investment decisions around since you started iTulip in 1998, were no big deal?
EJ: The two crises that defined the 2000 to 2011 era, while traumatic, were side-shows to the main event, spin-offs of a larger systemic problem. The models that drove our decisions to get out of stocks and into Treasury bonds and gold when we did were trivial compared to this latest update to Ka-Poom Theory. Ka-Poom Theory Update Two represents the current state of progress of 15 years of work. We are much closer to the finale now than in 1999 when the first version of Ka-Poom Theory was published after working on it for two years.
CE: The time scale is huge!
EJ: It’s hard to get your head around processes that go on for decades particularly for an event driven media and readers who are conditioned to think in terms of what is happening this week, today, this hour, and this minute.
CE: And you’re going to give it all away here?
EJ: No. I’m going to explain the thought process, the rules-based analytical frame work, so that readers can judge the quality of theory and how actionable it is without publishing the trades that the rules lead to. We haven’t decided exactly how to do that but will have figured that out by the time I finish with the argument. Simply giving the background will take several articles. A short book, in reality.
CE: Start by telling us about this mega systemic problem you referred to, the one that spun off the tech bubble and American Financial Crisis.
EJ: We have lived these past 30 years through a large-scale transformation of the U.S. economy. The world economy has been transformed, too, but for now we’ll focus on the U.S. because for most of the period that I’m talking about the world economy has revolved around the U.S. and to a large extent still does, even though the U.S. is a much smaller part of the world economy than it was 30 years ago, and that is part of the problem.
This transformation occurred so gradually as to give the result the aspect of normalcy, like that yellowing wallpaper in your pantry that you grow used to because it’s in your field of vision every day. If you go on an extended trip you may then might you notice when you return, “I have to do something about that wallpaper. It’s pealing off the walls.” That’s one of the key challenges to developing a macro theory like Ka-Poom Theory. You are living inside the system with everyone else and have for your whole life. That extraordinary appears ordinary because we have adapted to it. It’s a downside of a very useful ability of humans to adapt to almost anything. Visit a country where the people live in terrible economic and political conditions. You ask, How can anyone live like this? But to them it’s home.
To see the macro-economic mess I am living inside with everyone else I have to “leave it” from a perceptual standpoint then come back to it, over and over again. This is done by abstracting it via the data and repeatedly re-analyzing the data.
CE: Isn’t there an emotional challenge?
EJ: There is always an emotional challenge to any economic analysis that leads to an unhappy conclusion but more so to Ka-Poom Theory than for my tech bubble and mortgage security bubble forecasts. The implications of a reversion to sustainable debt levels and growth rates that Ka-Poom Theory predicts range from highly disruptive to dire depending on the policy response scenario. It’s not like my family and I will somehow be immune to it. Looking out the window on this beautiful spring day, it’s hard to imagine. And, frankly, who wants to? It’s a bummer. So it’s important that I abstract myself from the analysis and do it as if I were analyzing and event outside my world. I have to pretend that it will not effect me personally, my family and friends, else it’s too hard.
CE: How do you do that? We all personalize things.
EJ: I have the benefit of years of experience as CEO of companies to help. As CEO of a company you have to abstract yourself from the equation. Your role is to look after this entity, this person, the company. You have to be able to decide to do things that may not be beneficial to you personally that are good for the company. In fact every decision you make is made on the basis of what’s the good of the company to the point where you have to willing to go to your board and say, “I’m not the right person to run this company anymore. The company had grown to outstrip my skill set,” if that is your belief. It’s quite unlike any other job in that respect. The experience provides an intellectual foundation for taking a self-abstracted approach to analyzing an event with a potential for negative personal impact.
CE: You talk in the outline about needing two brains to think about Ka-Poom Theory. Is that what you mean?
EJ: That’s an additional and even more vexing challenge. You need to think with two minds at once to understand and act on Ka-Poom Theory. You need one that thinks of the world continuing for many years just as it has and acting on that basis because an object in motion tends to remain in motion. In that scenario Ka-Poom event is put off via a series of creative crisis response policies no less radical and invasive to markets than the Fed’s anti-deflation measures and asset price inflation measures since 2009.
CE: I remember. You argued with the deflationists that the Fed was going to buy mortgage-backed securities. They didn’t believe you!
EJ: I don’t blame them. It takes a strong stomach for anyone who believes in the power of markets to countenance a horrifically bad idea like as “yield curve shaping” that the Fed had on the table in 2006 in preparation for the crash they knew was coming but were politically unable to prevent. While you are thinking about investing and behaving on the theory that the economy will continue to improve and the stock market will rise, at the same time you need to be aware that a Ka-Poom event may happen virtually at any time, triggered by a geopolitical event. In that scenario monetary authorities fail and the world is thrown into disarray for several years.
CE: Your timing of this update is peculiar to say the least. The front page is NASDAQ 3000. Jobless claims are down! The crisis is over! Bull market away! Not buying it?
EJ: The NASDAQ 3000 milestone has special significance for iTulip. We started out in 1998 warning readers about the tech bubble. I urged them to sell tech stocks in March 2000, as I was doing when running Osborn Capital. I forecast at the time an 80% crash and for the NASDAQ and for the index to remain 50% below peak for a decade. In order to reach its previous March 2000 average inflation-adjusted monthly peak level 12 years ago this month, the NASDAQ needs to be at 6270. I was optimistic when I forecast the NASDAQ to remain 50% off peak for 10 years. Here we are 12 years later and it’s off 52% from peak.
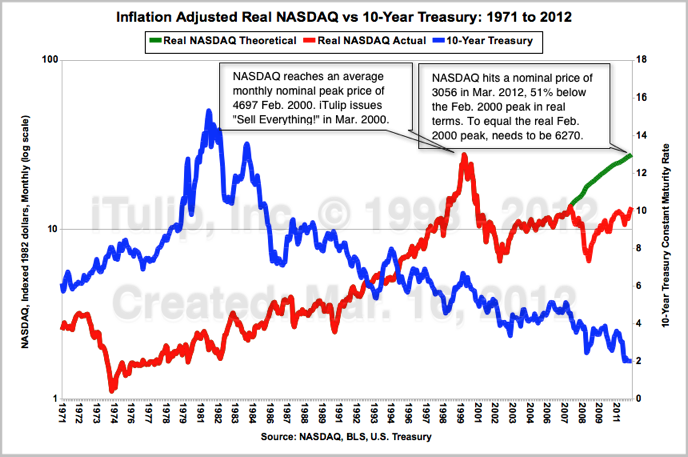
The NASDAQ deflated by the CPI in red is shown on a log scale on the left hand axis to accurately depict
the price level over a multi-decade timeline. The 10-Year Treasury bond constant maturity rate
in blue with a scale in percent on the right will feature in nearly every graph in
this analysis for reasons that will be explained. The green line depicts the NASDAQ
at a theoretical 6250 today to equal the year 2000 peak in real terms.
But I do not expect the NASDAQ to return to its 2000 peak any time soon. That’s not how bubbles operate. A more realistic hope is to reach the level where the NASDAQ might be today if the tech bubble, the housing bubble, and the American Financial Crisis (AFC) never occurred. Note that the NASDAQ powered through The Great Inflation of the late 1970s, the 1980 to 1983 recessions, the 1987 crash, and the 1990 recession all with relatively minor corrections, at least when taken in the long run view of a semi-log scale. It took the NASDAQ bubble and the AFC to derail the marvelous NASDAQ machine. The derailing was a predictable tragedy and why in 1999 I was writing angry articles for Bankrate.com and others while Greenspan prattled on about bubbles being discernible only after the fact. That said, it appears that the NASDAQ has finally gotten back on track if we follow the price trend growth rate since 1974. In fact we’re 3% below a sans-bubbles target level.
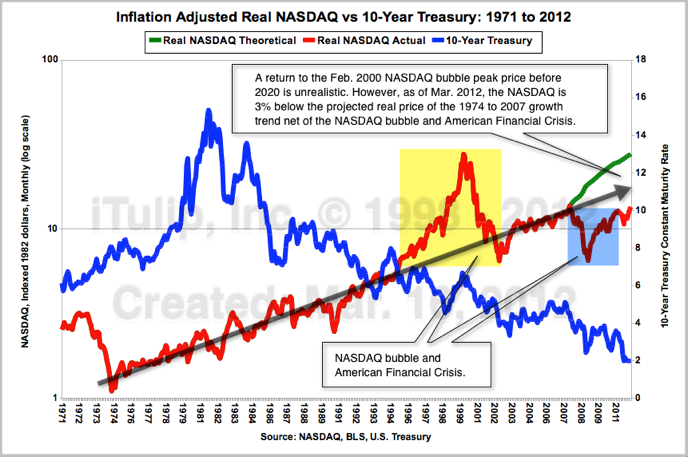
CE: That’s encouraging. Are you saying the NASDAQ is 3% under-priced?
EJ: Yes and no. The difficulty, as we shall see, is in the structure of the economy itself that produced not only the bubbles but also the trend growth rate sans bubbles since the early 1970s.
CE: Explain why most of the graphs used in this analysis compare market and economic data to bond yields?
EJ: Because the era of transformation we are talking about here is about falling interest rates and rising debt levels, and how the entire economy organized itself around this over a period of 30 years, and then how the Fed and the Treasury Dept. extended the era beyond its natural terminus in an effort to maintain the faulty structure. They have done it by purchasing debt and selling it to an expanding pool of foreign lenders. During the recession when yields got blown out, the market was trying to correct for the excessive debt levels by re-pricing debt to reflect actual default risk. But the Fed interfered, necessarily at first to prevent a debt deflation spiral, but is still at it because the economy is geared to low interest rates. One of our venerable members, Finster, put it brilliantly. It’s like taking a blown fuse out of the fuse box and replacing it with a quarter to keep all the lights on instead of reducing the load on the circuit and replacing the fuse.
CE: And then add a refrigerator and toaster and microwave oven…
EJ: Exactly. Instead, the markets have followed the Fed’s signal and increased the load on circuit. Now, the reason the fuse blew in the first place was because of the excessive load, that is, too much debt in aggregate for the economy. The market indicated, by blowing the fuse, that there is not enough cash flow from the incomes of firms and households to pay principle and interest on all of the debt and also finance production and consumption. With a quarter shorting out the circuit – with the Fed and Treasury holding down interest rates – the wires heat up inside the walls where you can’t see them. Likewise the credit risk is building up out of sight from the short-circuiting of the credit market risk pricing mechanisms. The Fed is not allowing interest rates to rise.
CE: The end result?
EJ: Sooner or later the house catches on fire. And that’s what we’re going to get, the bond and currency market version of a house fire. Ka-Poom Theory describes how the fire starts, how it is likely to burn, and what the authorities may try to do to put it out.
CE: What about credit derivatives? Shouldn’t they be flashing red if credit risk is rising?
EJ: No, because the government is the effective counterparty. Instead you will see risk exhibited in the currency markets. The currency market is where the fire is going to start. You can already see the wires are hot but not yet glowing.
CE: Where?
EJ: At the end of this multi-part series we’ll talk about imminent indicators, but there is one indicator hidden in plain site that most analysts miss.
CE: Gold?
EJ: Correct. Gold has been called a bubble and over-priced and so forth since 2006. By focusing on the price rather than how it got there, most market analysts miss what the gold price is telling us. First of all, they don’t understand what happened last time gold prices went up. I put some time into explaining the history in this series. After reading through hundreds of newspaper stories from the 1960s through the 1980s I can tell you that it didn’t happen the way I remembered.
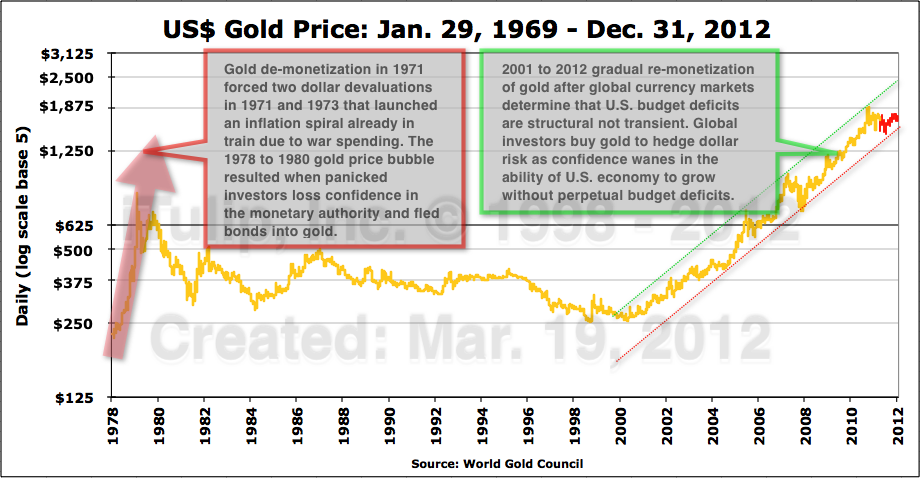
CE: This month you’ve posted several samples of newspaper stories you dug up. Looking forward to seeing more of that. Explain the chart above.
EJ: The gold panic of 1978 to 1980 was all about investors losing confidence in the Fed. At first there were high hopes when Paul Volcker took over from Arthur Burns, but markets didn’t understand that Volcker’s approach wasn’t going to work right away and investors panicked into gold. Volcker’s approach looked very much like the one that Burns had taken for the previous six years but to no avail. Volcker raised short-term rates well above the inflation rate just as Burns had. It took market participants until 1982 to understand that unlike Burns who backed off at the first sign of recession, Volcker had it in mind to drive the economy into a deep recession and kill off the inflation spiral by taking the pricing power out of labor, which occurred once unemployment reached about 10%. I call it the Monetary Sledgehammer. Crude but effective. We’ll get into the specifics later next because the event is the foundation of the FIRE Economy.
CE: The world after Ka-Poom. What’s it like?
EJ: The world didn’t end after the tech bubble, but that world ended, the world of over-priced tech stocks and all that went with it – the venture capital boom, the boom in corporate law, accounting, and so on. All gone. Five years after the boom in housing that employed one out of 100 people in California at its peak the world of real estate is likewise a shadow of its bubble era self. So, what I’m saying is, after Ka-Poom happens, the world doesn't end, but much of what we think of as normal in our world will no longer exist. Our economy will become something else – smaller, slower, poorer, but still quite wealthy by the standards of the world – but with islands of economic prosperity.
CE: After Ka-Poom happens, what will the Fed and mainstream economists say this time?
EJ: The same as after the tech bubble and housing bubbles we forecast to the month and profited on by avoiding the crash: “Who could have known?”
Ka-Poom Theory Update Two – Introduction: A Theory of a Sudden Adjustment ($ubscription)
A second main road near iTulip offices is closed the day after a once in 100 years
October 2011 snowstorm knocked down trees and cut power to homes for several weeks.
There was only one road out of four as the other three roads were blocked by fallen trees.
What happens when the world’s largest economy develops an increasingly over-leveraged, foreign debt dependent growth model over two decades, then goes through two successive self-indulgent market bubble parties and busts in ten years, which cause recessions that demand monetary and fiscal stimulus to keep the indulgent population compliant yet weaken the nation’s fiscal position to near the breaking point, and then said nation experiences a final existential fiscal shock?
Well. We’re going to find out.
In this update we explain the terminus of a sequence of unintended consequences of monetary policy decisions made starting in the 1960s:
This series adds to 15 years of work to develop a theory of an eventual U.S. currency and bond crisis.
It’s called Ka-Poom Theory.
I first published Ka-Poom Theory in 1999 shortly after starting iTulip and updated it once since then in 2006. This is a second update and, I hope for all of our sakes, not the last, for the event that it models will change the world forever if it comes to pass, and not in a way that anyone will experience favorably.
The term Ka-Poom arises from the characteristic trajectory of inflation, bond prices, and exchange rates immediately before and after a currency and bond crisis experienced sooner or later by every nation throughout history that has made the following fatal error.
Starting from sound economic policies and fiscal prudence, the country is able to borrow from foreign credit and currency markets both to finance trade and a portion of public expenditure. Over the years the borrower country, and it creditors, become a victim of the debtor nation’s success.
We will build our Ka-Poom rules list as we continue through our analysis starting with Rule #1.
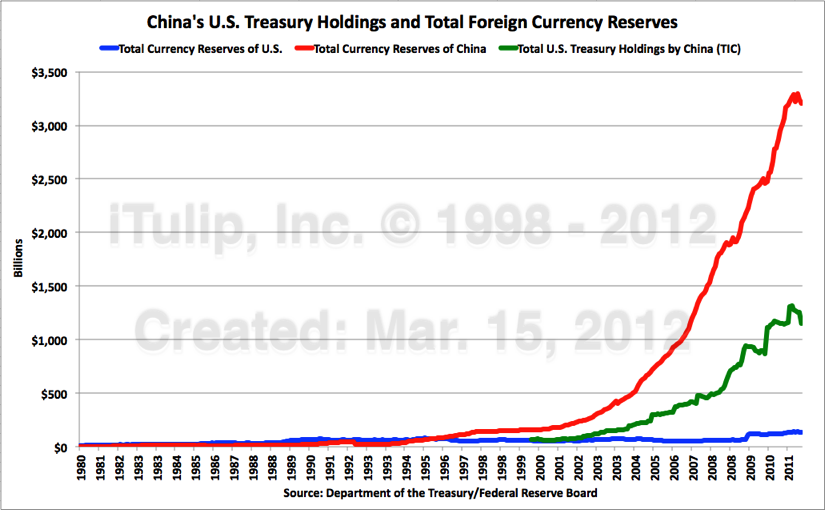
The red line is China’s total currency reserves that have accumulated since the early 1990s
as China balanced its current account surplus via purchases of U.S. Treasury bonds.
The green line are holdings of U.S. Treasury bonds purchased to help finance
U.S. budget deficits starting in 2001.
As credit expands the purchasing power of households, firms, and the government itself, the debtor nation’s apparent wealth grows. The political leadership begins to suffer delusions of grandeur. They convince themselves and their constituents, and attempt to convince creditors, that the country’s budget deficits and outsized public promises are sustainable. Creditors go along with the ruse for a while because they have no choice. In the process of lending so much to the debtor country and holding so much of that nation’s currency they become beholden. On and on it goes until a revelation is produced by an election or an epiphany by an unforeseen event. Then years or even decades of pent up risk produce a quick unwind.
Could this really happen to the world’s largest economy? To the nation that issues and owes its foreign debt in the world’s primary reserve currency?
No say proponents of Modern Monetary Theory one of several theories to appear recently to explain an absence of the popularly expected symptom of risk of a sovereign debt crisis: rising interest rates. Ka-Poom Theory is an alternative explanation.
Illusion of American Immunity
Is the sovereign that owes its foreign debt in its own currency immune to a catastrophic currency and bond crisis? Owing reparations debts in domestic Papiermarks that only Germany could issue didn’t protect Germany from hyperinflation in 1923. Another challenge to this argument is the fact that the U.S. has already had a currency and bond crisis. With very little external debt and all of it owed in dollars, when The Great Inflation occurred in the 1970s bond yields soared and the dollar tanked. MMT proponents claim that the central bank and Treasury intended this outcome. Did the Treasury then make the choice to issue Carter bonds, U.S. Treasury bonds denominated in West German Deutschmarks and Swiss Francs in 1978, for any reason other than to prevent the dollar from falling further? We will look into this question in greater detail later in this Ka-Poom update series. more... $ubscription
iTulip Select: The Investment Thesis for the Next Cycle™
__________________________________________________
To receive the iTulip Newsletter or iTulip Alerts, Join our FREE Email Mailing List
Copyright © iTulip, Inc. 1998 - 2012 All Rights Reserved
All information provided "as is" for informational purposes only, not intended for trading purposes or advice. Nothing appearing on this website should be considered a recommendation to buy or to sell any security or related financial instrument. iTulip, Inc. is not liable for any informational errors, incompleteness, or delays, or for any actions taken in reliance on information contained herein. Full Disclaimer
A main road near iTulip offices the day after a once in 100 years October 2011 snowstorm
knocked down trees and cut power to homes for several weeks.
CE: After reading your Ka-Poom Theory update outline… oh, boy. Huge project. Okay, we eat this elephant one bite at a time. I want to start by getting the chronology down. Readers may be either new and they don’t know the history or they are old farts like me who can’t remember. Those of us who started to read your work in 1998 think first of your tech bubble tracking start-to-bust. You famously told us to get out of stocks in March 2000. Then in 2001 you went off to run a couple of VC-backed companies. You started to track the housing bubble in 2002 while you were still doing that. Where did you find the time?
EJ: I only updated iTulip two or three times a year to note turning points in the housing bubble as it developed, such as the start in 2002 and the peak between 2005 and 2006 depending on the market segment, and to lay out my model for the rate and duration of the decline, which I determined to be 10 to 15 years from 2005, depending on the form and extent of government interference in the market's mean reversion process. I still expect a price correction to reach inflation-adjusted year 2000 price levels before the housing correction is over.
CE: You restarted iTulip full time in March 2006. You laid it all out – the coming crash of the securitized mortgage market, the global financial crisis, the mega recession, but you also said “no” to deflation and go that right, too. You were probably the first to identify the threat posed by the bubble in mortgage-backed securities. Your December 2007 timing on the stock market was epic. You said to look out for a 40% decline in the S&P500 in 2008. We got 38%. Nice. And you noted in March 2009 that the crash was over and a bounce started.
EJ: Let me interrupt you there because subsequent to all of that I was wrong about the duration of that bounce off the March 2009 lows. Except for a minor correction in April 2010 the stock market has recovered much of the loss in nominal terms.
CE: Heavy on the “nominal.”
EJ: Right, as I note in this analysis, and you saw in the outline, the S&P500 is still 31% below its March 2000 peak in inflation-adjusted terms. Of the two chances readers got to dodge the “Buy and Hold” stocks bullet, either in March 2000 and December 2007, March 2000 was the better of the two.
CE: That’s when you “sold everything” and went into 10-year Treasury bonds and cash, back when the yield on the 10-year was 6%?
EJ: 6.5%.
CE: A year later you took a 15% portfolio slug in gold at $270?
EJ: Average buy-in price was $270. And never sold it.
CE: That’s all on the record and verified. CNBC and all that. Your friends at Twin Focus Capital Partners validated your bond plus gold portfolio performance up to 2010. Okay, then in the middle of 2010 you started to fret about the Treasury bond slug of your portfolio, and look for stuff to divest into from bonds. You and some itulipers invested in Eastham Capital in 2010 based on your “rising rents” theory. How’s that doing?
EJ: Better than a 10-Year Treasury bond; over 12% cash-on-cash so far. Unfortunately it’s not something that the all of our members could invest in. The group is always looking for ways to invest in the trends we identify through our research and analysis.
CE: Then you and members put money into a start-up called TruTouch Technologies in line with your theory that tech entrepreneurs are the last great hope for the U.S. economy. How’s that going?
EJ: Too soon to say, but promising so far.
CE: I’ve always wanted to ask, you made piles of money getting out of the tech bubble at the top and shorting it, buying gold in 2001 at $270 and never selling it, shorting stocks in 2007… what do your friends and family make of you? Are they pessimistic like you?
EJ: I prefer to think of myself as a skeptical realist. On the one hand, I’m optimistic enough to invest in start-up companies like TruTouch Technologies and others, but on the other I’ve learned to listen to the data and endeavor to understand the underlying processes that drive the markets and economy. I don’t put much stock in the theories of anyone who has anything to sell, and certainly not in the policy makers who are making it up as they go along. The data telling me that we are well along in a self-limiting process that started more than 30 years ago. It’s going to be quite a shock when it ends some day.
CE: Now you’re telling us that the two big crises that defined the 2000 to 2011 period and you made your timing and investment decisions around since you started iTulip in 1998, were no big deal?
EJ: The two crises that defined the 2000 to 2011 era, while traumatic, were side-shows to the main event, spin-offs of a larger systemic problem. The models that drove our decisions to get out of stocks and into Treasury bonds and gold when we did were trivial compared to this latest update to Ka-Poom Theory. Ka-Poom Theory Update Two represents the current state of progress of 15 years of work. We are much closer to the finale now than in 1999 when the first version of Ka-Poom Theory was published after working on it for two years.
CE: The time scale is huge!
EJ: It’s hard to get your head around processes that go on for decades particularly for an event driven media and readers who are conditioned to think in terms of what is happening this week, today, this hour, and this minute.
CE: And you’re going to give it all away here?
EJ: No. I’m going to explain the thought process, the rules-based analytical frame work, so that readers can judge the quality of theory and how actionable it is without publishing the trades that the rules lead to. We haven’t decided exactly how to do that but will have figured that out by the time I finish with the argument. Simply giving the background will take several articles. A short book, in reality.
CE: Start by telling us about this mega systemic problem you referred to, the one that spun off the tech bubble and American Financial Crisis.
EJ: We have lived these past 30 years through a large-scale transformation of the U.S. economy. The world economy has been transformed, too, but for now we’ll focus on the U.S. because for most of the period that I’m talking about the world economy has revolved around the U.S. and to a large extent still does, even though the U.S. is a much smaller part of the world economy than it was 30 years ago, and that is part of the problem.
This transformation occurred so gradually as to give the result the aspect of normalcy, like that yellowing wallpaper in your pantry that you grow used to because it’s in your field of vision every day. If you go on an extended trip you may then might you notice when you return, “I have to do something about that wallpaper. It’s pealing off the walls.” That’s one of the key challenges to developing a macro theory like Ka-Poom Theory. You are living inside the system with everyone else and have for your whole life. That extraordinary appears ordinary because we have adapted to it. It’s a downside of a very useful ability of humans to adapt to almost anything. Visit a country where the people live in terrible economic and political conditions. You ask, How can anyone live like this? But to them it’s home.
To see the macro-economic mess I am living inside with everyone else I have to “leave it” from a perceptual standpoint then come back to it, over and over again. This is done by abstracting it via the data and repeatedly re-analyzing the data.
CE: Isn’t there an emotional challenge?
EJ: There is always an emotional challenge to any economic analysis that leads to an unhappy conclusion but more so to Ka-Poom Theory than for my tech bubble and mortgage security bubble forecasts. The implications of a reversion to sustainable debt levels and growth rates that Ka-Poom Theory predicts range from highly disruptive to dire depending on the policy response scenario. It’s not like my family and I will somehow be immune to it. Looking out the window on this beautiful spring day, it’s hard to imagine. And, frankly, who wants to? It’s a bummer. So it’s important that I abstract myself from the analysis and do it as if I were analyzing and event outside my world. I have to pretend that it will not effect me personally, my family and friends, else it’s too hard.
CE: How do you do that? We all personalize things.
EJ: I have the benefit of years of experience as CEO of companies to help. As CEO of a company you have to abstract yourself from the equation. Your role is to look after this entity, this person, the company. You have to be able to decide to do things that may not be beneficial to you personally that are good for the company. In fact every decision you make is made on the basis of what’s the good of the company to the point where you have to willing to go to your board and say, “I’m not the right person to run this company anymore. The company had grown to outstrip my skill set,” if that is your belief. It’s quite unlike any other job in that respect. The experience provides an intellectual foundation for taking a self-abstracted approach to analyzing an event with a potential for negative personal impact.
CE: You talk in the outline about needing two brains to think about Ka-Poom Theory. Is that what you mean?
EJ: That’s an additional and even more vexing challenge. You need to think with two minds at once to understand and act on Ka-Poom Theory. You need one that thinks of the world continuing for many years just as it has and acting on that basis because an object in motion tends to remain in motion. In that scenario Ka-Poom event is put off via a series of creative crisis response policies no less radical and invasive to markets than the Fed’s anti-deflation measures and asset price inflation measures since 2009.
CE: I remember. You argued with the deflationists that the Fed was going to buy mortgage-backed securities. They didn’t believe you!
EJ: I don’t blame them. It takes a strong stomach for anyone who believes in the power of markets to countenance a horrifically bad idea like as “yield curve shaping” that the Fed had on the table in 2006 in preparation for the crash they knew was coming but were politically unable to prevent. While you are thinking about investing and behaving on the theory that the economy will continue to improve and the stock market will rise, at the same time you need to be aware that a Ka-Poom event may happen virtually at any time, triggered by a geopolitical event. In that scenario monetary authorities fail and the world is thrown into disarray for several years.
CE: Your timing of this update is peculiar to say the least. The front page is NASDAQ 3000. Jobless claims are down! The crisis is over! Bull market away! Not buying it?
EJ: The NASDAQ 3000 milestone has special significance for iTulip. We started out in 1998 warning readers about the tech bubble. I urged them to sell tech stocks in March 2000, as I was doing when running Osborn Capital. I forecast at the time an 80% crash and for the NASDAQ and for the index to remain 50% below peak for a decade. In order to reach its previous March 2000 average inflation-adjusted monthly peak level 12 years ago this month, the NASDAQ needs to be at 6270. I was optimistic when I forecast the NASDAQ to remain 50% off peak for 10 years. Here we are 12 years later and it’s off 52% from peak.
The NASDAQ deflated by the CPI in red is shown on a log scale on the left hand axis to accurately depict
the price level over a multi-decade timeline. The 10-Year Treasury bond constant maturity rate
in blue with a scale in percent on the right will feature in nearly every graph in
this analysis for reasons that will be explained. The green line depicts the NASDAQ
at a theoretical 6250 today to equal the year 2000 peak in real terms.
But I do not expect the NASDAQ to return to its 2000 peak any time soon. That’s not how bubbles operate. A more realistic hope is to reach the level where the NASDAQ might be today if the tech bubble, the housing bubble, and the American Financial Crisis (AFC) never occurred. Note that the NASDAQ powered through The Great Inflation of the late 1970s, the 1980 to 1983 recessions, the 1987 crash, and the 1990 recession all with relatively minor corrections, at least when taken in the long run view of a semi-log scale. It took the NASDAQ bubble and the AFC to derail the marvelous NASDAQ machine. The derailing was a predictable tragedy and why in 1999 I was writing angry articles for Bankrate.com and others while Greenspan prattled on about bubbles being discernible only after the fact. That said, it appears that the NASDAQ has finally gotten back on track if we follow the price trend growth rate since 1974. In fact we’re 3% below a sans-bubbles target level.
CE: That’s encouraging. Are you saying the NASDAQ is 3% under-priced?
EJ: Yes and no. The difficulty, as we shall see, is in the structure of the economy itself that produced not only the bubbles but also the trend growth rate sans bubbles since the early 1970s.
CE: Explain why most of the graphs used in this analysis compare market and economic data to bond yields?
EJ: Because the era of transformation we are talking about here is about falling interest rates and rising debt levels, and how the entire economy organized itself around this over a period of 30 years, and then how the Fed and the Treasury Dept. extended the era beyond its natural terminus in an effort to maintain the faulty structure. They have done it by purchasing debt and selling it to an expanding pool of foreign lenders. During the recession when yields got blown out, the market was trying to correct for the excessive debt levels by re-pricing debt to reflect actual default risk. But the Fed interfered, necessarily at first to prevent a debt deflation spiral, but is still at it because the economy is geared to low interest rates. One of our venerable members, Finster, put it brilliantly. It’s like taking a blown fuse out of the fuse box and replacing it with a quarter to keep all the lights on instead of reducing the load on the circuit and replacing the fuse.
CE: And then add a refrigerator and toaster and microwave oven…
EJ: Exactly. Instead, the markets have followed the Fed’s signal and increased the load on circuit. Now, the reason the fuse blew in the first place was because of the excessive load, that is, too much debt in aggregate for the economy. The market indicated, by blowing the fuse, that there is not enough cash flow from the incomes of firms and households to pay principle and interest on all of the debt and also finance production and consumption. With a quarter shorting out the circuit – with the Fed and Treasury holding down interest rates – the wires heat up inside the walls where you can’t see them. Likewise the credit risk is building up out of sight from the short-circuiting of the credit market risk pricing mechanisms. The Fed is not allowing interest rates to rise.
CE: The end result?
EJ: Sooner or later the house catches on fire. And that’s what we’re going to get, the bond and currency market version of a house fire. Ka-Poom Theory describes how the fire starts, how it is likely to burn, and what the authorities may try to do to put it out.
CE: What about credit derivatives? Shouldn’t they be flashing red if credit risk is rising?
EJ: No, because the government is the effective counterparty. Instead you will see risk exhibited in the currency markets. The currency market is where the fire is going to start. You can already see the wires are hot but not yet glowing.
CE: Where?
EJ: At the end of this multi-part series we’ll talk about imminent indicators, but there is one indicator hidden in plain site that most analysts miss.
CE: Gold?
EJ: Correct. Gold has been called a bubble and over-priced and so forth since 2006. By focusing on the price rather than how it got there, most market analysts miss what the gold price is telling us. First of all, they don’t understand what happened last time gold prices went up. I put some time into explaining the history in this series. After reading through hundreds of newspaper stories from the 1960s through the 1980s I can tell you that it didn’t happen the way I remembered.
CE: This month you’ve posted several samples of newspaper stories you dug up. Looking forward to seeing more of that. Explain the chart above.
EJ: The gold panic of 1978 to 1980 was all about investors losing confidence in the Fed. At first there were high hopes when Paul Volcker took over from Arthur Burns, but markets didn’t understand that Volcker’s approach wasn’t going to work right away and investors panicked into gold. Volcker’s approach looked very much like the one that Burns had taken for the previous six years but to no avail. Volcker raised short-term rates well above the inflation rate just as Burns had. It took market participants until 1982 to understand that unlike Burns who backed off at the first sign of recession, Volcker had it in mind to drive the economy into a deep recession and kill off the inflation spiral by taking the pricing power out of labor, which occurred once unemployment reached about 10%. I call it the Monetary Sledgehammer. Crude but effective. We’ll get into the specifics later next because the event is the foundation of the FIRE Economy.
CE: The world after Ka-Poom. What’s it like?
EJ: The world didn’t end after the tech bubble, but that world ended, the world of over-priced tech stocks and all that went with it – the venture capital boom, the boom in corporate law, accounting, and so on. All gone. Five years after the boom in housing that employed one out of 100 people in California at its peak the world of real estate is likewise a shadow of its bubble era self. So, what I’m saying is, after Ka-Poom happens, the world doesn't end, but much of what we think of as normal in our world will no longer exist. Our economy will become something else – smaller, slower, poorer, but still quite wealthy by the standards of the world – but with islands of economic prosperity.
CE: After Ka-Poom happens, what will the Fed and mainstream economists say this time?
EJ: The same as after the tech bubble and housing bubbles we forecast to the month and profited on by avoiding the crash: “Who could have known?”
Ka-Poom Theory Update Two – Introduction: A Theory of a Sudden Adjustment ($ubscription)
A second main road near iTulip offices is closed the day after a once in 100 years
October 2011 snowstorm knocked down trees and cut power to homes for several weeks.
There was only one road out of four as the other three roads were blocked by fallen trees.
What happens when the world’s largest economy develops an increasingly over-leveraged, foreign debt dependent growth model over two decades, then goes through two successive self-indulgent market bubble parties and busts in ten years, which cause recessions that demand monetary and fiscal stimulus to keep the indulgent population compliant yet weaken the nation’s fiscal position to near the breaking point, and then said nation experiences a final existential fiscal shock?
Well. We’re going to find out.
In this update we explain the terminus of a sequence of unintended consequences of monetary policy decisions made starting in the 1960s:
- The immediate unintended consequence of leaving the international gold standard and allowing the dollar to float in 1971 was rapid depreciation of the dollar against major currencies.
- The consequence of rapid depreciation of the dollar was the same as it has always been for any country throughout history: a surge of cost-push inflation. Combined with war spending and other government spending, cost-push inflation met credit expansion to launch a wage-price spiral. Development of inflation into hyperinflation was averted by application of the Monetary Sledgehammer starting in 1979.
- A four decade long bear market in bonds starting in 1946 suppressed debt growth. Then The Great Inflation of the 1970s deflated debt against wages and incomes. The Monetary Sledgehammer was applied to an U.S. economy with very low aggregate debt levels.
- As long-term government securities interest rates fell from as high as 14.43% in 1982, debt across the entire economy was re-financed over and over for 20 years.
- The unintended consequence of falling interest rates was aggregate over-indebtedness and structural dependence on debt expansion for economic growth, i.e., financialization of the economy.
- The unintended consequence of over-indebtedness, dependence on debt expansion for economic growth, and financialization is dependence on low interest rates.
- The unintended consequence of dependence on low interest rates is reliance on an ever-increasing the pool of foreign and domestic purchasers and direct purchases by the Fed to absorb new Treasury bond issuance.
- A crisis begins when the the Fed is no longer able to buy Treasury bonds and the Treasury is no longer able to expand the pool of foreign and domestic purchasers to absorb new debt issuance.
This series adds to 15 years of work to develop a theory of an eventual U.S. currency and bond crisis.
It’s called Ka-Poom Theory.
I first published Ka-Poom Theory in 1999 shortly after starting iTulip and updated it once since then in 2006. This is a second update and, I hope for all of our sakes, not the last, for the event that it models will change the world forever if it comes to pass, and not in a way that anyone will experience favorably.
The term Ka-Poom arises from the characteristic trajectory of inflation, bond prices, and exchange rates immediately before and after a currency and bond crisis experienced sooner or later by every nation throughout history that has made the following fatal error.
Starting from sound economic policies and fiscal prudence, the country is able to borrow from foreign credit and currency markets both to finance trade and a portion of public expenditure. Over the years the borrower country, and it creditors, become a victim of the debtor nation’s success.
We will build our Ka-Poom rules list as we continue through our analysis starting with Rule #1.
Ka-Poom Rule #1: The uneconomical buildup of aggregate private and public domestic debt and external debt that precede a Ka-Poom currency and debt crisis is a geopolitical not a market phenomenon.
The red line is China’s total currency reserves that have accumulated since the early 1990s
as China balanced its current account surplus via purchases of U.S. Treasury bonds.
The green line are holdings of U.S. Treasury bonds purchased to help finance
U.S. budget deficits starting in 2001.
As credit expands the purchasing power of households, firms, and the government itself, the debtor nation’s apparent wealth grows. The political leadership begins to suffer delusions of grandeur. They convince themselves and their constituents, and attempt to convince creditors, that the country’s budget deficits and outsized public promises are sustainable. Creditors go along with the ruse for a while because they have no choice. In the process of lending so much to the debtor country and holding so much of that nation’s currency they become beholden. On and on it goes until a revelation is produced by an election or an epiphany by an unforeseen event. Then years or even decades of pent up risk produce a quick unwind.
Could this really happen to the world’s largest economy? To the nation that issues and owes its foreign debt in the world’s primary reserve currency?
No say proponents of Modern Monetary Theory one of several theories to appear recently to explain an absence of the popularly expected symptom of risk of a sovereign debt crisis: rising interest rates. Ka-Poom Theory is an alternative explanation.
Illusion of American Immunity
Is the sovereign that owes its foreign debt in its own currency immune to a catastrophic currency and bond crisis? Owing reparations debts in domestic Papiermarks that only Germany could issue didn’t protect Germany from hyperinflation in 1923. Another challenge to this argument is the fact that the U.S. has already had a currency and bond crisis. With very little external debt and all of it owed in dollars, when The Great Inflation occurred in the 1970s bond yields soared and the dollar tanked. MMT proponents claim that the central bank and Treasury intended this outcome. Did the Treasury then make the choice to issue Carter bonds, U.S. Treasury bonds denominated in West German Deutschmarks and Swiss Francs in 1978, for any reason other than to prevent the dollar from falling further? We will look into this question in greater detail later in this Ka-Poom update series. more... $ubscription
iTulip Select: The Investment Thesis for the Next Cycle™
__________________________________________________
To receive the iTulip Newsletter or iTulip Alerts, Join our FREE Email Mailing List
Copyright © iTulip, Inc. 1998 - 2012 All Rights Reserved
All information provided "as is" for informational purposes only, not intended for trading purposes or advice. Nothing appearing on this website should be considered a recommendation to buy or to sell any security or related financial instrument. iTulip, Inc. is not liable for any informational errors, incompleteness, or delays, or for any actions taken in reliance on information contained herein. Full Disclaimer


Comment