Announcement

Collapse
No announcement yet.

SP500 vs CDs, Big Picture

Collapse
X
 
  • Filter
  • Time
  • Show
Clear All
new posts

  • SP500 vs CDs, Big Picture

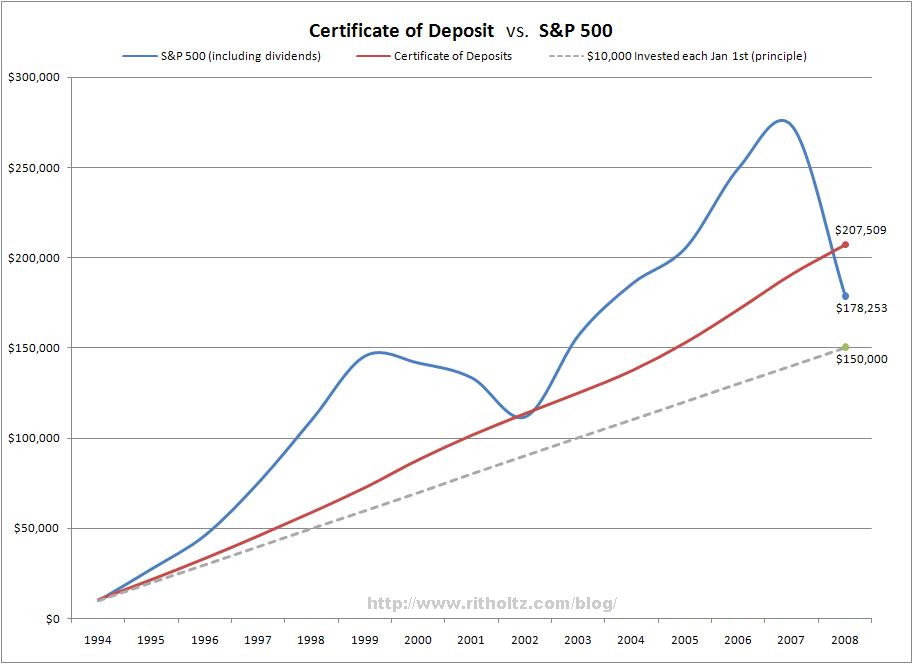
    Interesting graph on the Big Picture blog. Would be nice if they had also shown an adjusted for inflation graph.

    Entry here, including source data (for those that want to fact-check for us): http://www.ritholtz.com/blog/2009/07...cds-1994-2008/


  • #2
    Re: SP500 vs CDs, Big Picture

    What is really off about this analysis is the term of the cd's they used. The site says they used the 6 month cd rates. I have slammed the market by doing what they suggested except I never ever invest for 6 months. Almost always at least five years. Imagine what the graph would loook like with a realistic cd rate.

    Comment


    • #3
      Re: SP500 vs CDs, Big Picture

      Originally posted by cindykimlisa View Post
      What is really off about this analysis is the term of the cd's they used. The site says they used the 6 month cd rates. I have slammed the market by doing what they suggested except I never ever invest for 6 months. Almost always at least five years. Imagine what the graph would loook like with a realistic cd rate.
      That is a very good point. Can you construct such a chart?
      Ed.

      Comment


      • #4
        Re: SP500 vs CDs, Big Picture

        Originally posted by FRED View Post
        That is a very good point. Can you construct such a chart?
        Here you go. I used 5 year rate of returns rolled over each year. I.e., $1000 invested at the 1993 5 year CD rate of return until 1994, at which time you have $1055 which is then invested at the 1994 5 year CD rate of return for one year, etc.

        I also used VTSMX (vanguard total stock market) and used the morningstar dataset that shows growth with dividends reinvested ... which makes a significant difference.

        I do not vouch for the accuracy of the data - the sets I used are:
        http://www.jumbocdinvestments.com/historicalcdrates.htm
        http://quote.morningstar.com/quote/f...on=USA&s=VTSMX

        Comment


        • #5
          Re: SP500 vs CDs, Big Picture

          Great Chart Munger I always enjoy reading your stuff.

          A few questions

          Does the index you suggest have a load and expenses and is it factored in the analysis you made? If you take a 3% hit every year on the 10,000 invested then that will make some difference.

          Also, I am not sure what the "total stock market" really is on a continuing basis. How do they factor in stocks which go totally bust like Enron and Worldcom. Essentially these are the problems I have making any sense with a comparison to cd's and the dow over a long period of time. Lot's of hocus pocus in the dow calculations!

          Comment


          • #6
            Re: SP500 vs CDs, Big Picture

            Originally posted by cindykimlisa View Post
            Great Chart Munger I always enjoy reading your stuff.

            A few questions

            Does the index you suggest have a load and expenses and is it factored in the analysis you made? If you take a 3% hit every year on the 10,000 invested then that will make some difference.

            Also, I am not sure what the "total stock market" really is on a continuing basis. How do they factor in stocks which go totally bust like Enron and Worldcom. Essentially these are the problems I have making any sense with a comparison to cd's and the dow over a long period of time. Lot's of hocus pocus in the dow calculations!
            VTSMX is an actual fund. This shows the real return after expenses. It's a Vanguard fund (which is a not-for-profit company), so it's no-load with a passive investment strategy (no trading = less fees). The expense ratio is low (around .2%). It is somewhat broader than the S&P 500 - it holds all common stocks on the NYSE (around 1300) - but tracks the S&P almost identically.

            Interesting that they come out almost identically like this. If we'd started in 1998 or so the CD's would have handily outperformed.

            Comment


            • #7
              Re: SP500 vs CDs, Big Picture

              Originally posted by cindykimlisa View Post
              Great Chart Munger I always enjoy reading your stuff.

              A few questions

              Does the index you suggest have a load and expenses and is it factored in the analysis you made? If you take a 3% hit every year on the 10,000 invested then that will make some difference.

              Also, I am not sure what the "total stock market" really is on a continuing basis. How do they factor in stocks which go totally bust like Enron and Worldcom. Essentially these are the problems I have making any sense with a comparison to cd's and the dow over a long period of time. Lot's of hocus pocus in the dow calculations!
              Accounting for survivor bias in long range measurements of stock indexes is very labor intensive. We have posted this material on the DOW since early 2006 to warn investors about various distortions in the DOW.
              Ed.

              Comment


              • #8
                Re: SP500 vs CDs, Big Picture

                Great work.

                Of course, the government subsidizes Stocks by taxes them at a lower rate than interest on cash.

                Comment


                • #9
                  Re: SP500 vs CDs, Big Picture

                  Originally posted by FRED View Post
                  That is a very good point. Can you construct such a chart?
                  Thanks for the graph Munger.

                  Actually, it would be interesting to see how the graph changes as you change the term of the CDs from 3mo to 5 yr, mostly because it is very telling re: CD yields over time. It's the same sort of analysis one does with treasuries vs stocks.

                  That said, I'm not sure that a 5 year CD is any more "realistic" than a 6-month CD. Perhaps in Cindy's case because this is how she would've saved in CDs.

                  The people that I know, well enough to know their finances, that save through CDs use two strategies: (a) 1-year revolving CDs (save and put on auto-pilot), and (b) adjust terms on each maturity date based on their expectations of future rates. Akin to what many of us do with treasuries.

                  If the analysis is going to focus on what would an average saver (and buy and hold investor) would pick, then perhaps the choice of CD should be based on what the most popular CD term (by avg deposits) is for the tenor that is being looked at. This may be the 5 year CD, I don't know. However, being that most savers in CDs do want to preserve some liquidity, my gut tells me that it is shorter.

                  Anyway, thanks for the discussion all.

                  Comment


                  • #10
                    Re: SP500 vs CDs, Big Picture

                    Originally posted by goadam1 View Post
                    Great work.

                    Of course, the government subsidizes Stocks by taxes them at a lower rate than interest on cash.
                    Absolutely, not to mention the pump-and-dump american dream selling machine. CDs are for grannies!

                    Comment


                    • #11
                      Re: SP500 vs CDs, Big Picture

                      Originally posted by FRED View Post
                      Accounting for survivor bias in long range measurements of stock indexes is very labor intensive. We have posted this material on the DOW since early 2006 to warn investors about various distortions in the DOW.
                      True. I believe that using an actual index fund would not lead to these distortions. Since VTSMX holds all stocks proportionally to market cap., when a company goes blotto they lose a little, but make up for it when another skyrockets.

                      Also, the returns of VTSMX do not show some mythical index with survivorship bias but the real returns of the actual fund minus expenses that anyone could have invested in. So it should be fairly realistic. Morningstar's new beta "charts" is pretty nice in that it shows growth of funds/stocks/bonds etc with dividends/interest payments reinvested. I don't think yahoo/google etc do this. Without taking that into account it really is apple's to oranges.

                      Comment


                      • #12
                        Re: SP500 vs CDs, Big Picture

                        "The people that I know, well enough to know their finances, that save through CDs use two strategies: (a) 1-year revolving CDs (save and put on auto-pilot), and (b) adjust terms on each maturity date based on their expectations of future rates. Akin to what many of us do with treasuries."

                        Cindy does b with laddering and uses cd's and other insured fixed income investments. Cindy also has a ten year insured cd with an apr of 7.9% from a big bank. Most others 5+%.

                        Comment


                        • #13
                          Re: SP500 vs CDs, Big Picture

                          Originally posted by cindykimlisa View Post
                          "The people that I know, well enough to know their finances, that save through CDs use two strategies: (a) 1-year revolving CDs (save and put on auto-pilot), and (b) adjust terms on each maturity date based on their expectations of future rates. Akin to what many of us do with treasuries."

                          Cindy does b with laddering and uses cd's and other insured fixed income investments. Cindy also has a ten year insured cd with an apr of 7.9% from a big bank. Most others 5+%.
                          As expected for an ituliper.

                          Comment


                          • #14
                            Re: SP500 vs CDs, Big Picture

                            Originally posted by WildspitzE View Post
                            Absolutely, not to mention the pump-and-dump american dream selling machine. CDs are for grannies!
                            most of my paper wealth is in short term cd's right now. Some are making me 4% risk free.

                            Comment

                            Working...
                            X