 Tweet
Tweet
USA, Inc. Common Shares: Long or Short?
by Eric Janszen
"The economy is robust," says one newspaper headline. Another reads, "U.S. household savings rate lower than since the Great Depression." Then you read, "Number of U.S. millionaires at all time record." Then, "Millions of households drowning in debt," and "Real wages declined 13 percent in past decade" and, "Unemployment at all time lows."
It just doesn't add up. Let's see if we can't make some sense out of all of these apparently contradictory reports, what it all means and where it is headed.
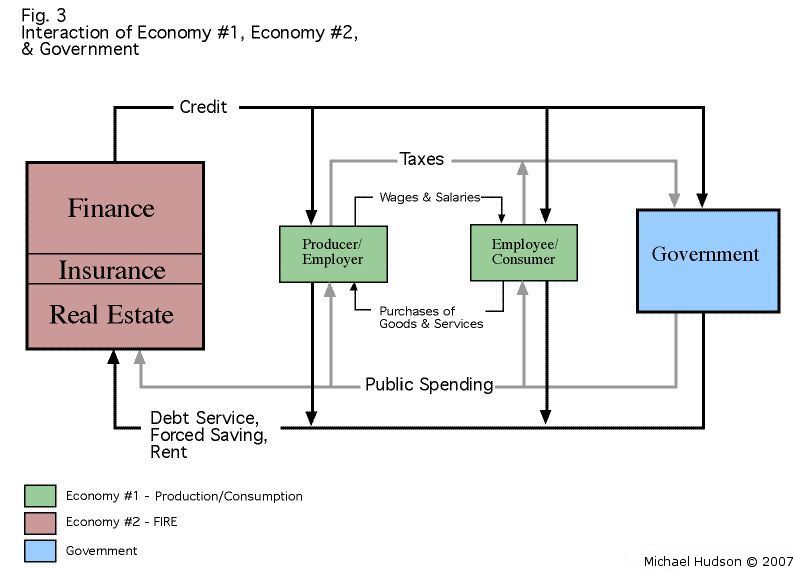
Dr. Michael Hudson explains in a recent iTulip.com article "Saving, Asset-Price Inflation, and Debt-Induced Deflation," that the U.S. economy is composed of two economies. One is the traditional Industrial Economy engaged in production and consumption of goods and services. This is the economy that economists typically talk about, the one that you see reported in the papers. The other economy is the Finance Economy, sometimes referred to by economists as Finance, Insurance and Real Estate or "FIRE Economy."
Both economies are heavily influenced by the government. Here is Dr. Hudson's diagram of the total economy.
A lot of readers are, like me, business people who find the economy easier to understand as a business discussed in concrete terms, rather than as an abstraction viewed in theoretical terms the way most economists tend to think and talk about it.
For today, let's refer to the multi-segment U.S. economy, comprised of a FIRE Economy and an Industrial Economy, as a company called USA, Inc. To understand the business of USA, Inc., we start by looking at the relative size of each of these two components.
We often read that USA, Inc. is not a production-consumption business. Instead, it has over the years become a "service" business. But is that really true? The question comes down to this: which parts of the economy are generating the most revenue (GDP), for whom, and how many jobs?
We can use the Bureau of Labored Statistics' (BLS) employment data to help figure out proportions of different sectors of the economy, but unfortunately employment data are not collected and reported in a way that makes the Finance Economy's and Industrial Economy's relative contributions to employment simple to determine. Finance Economy jobs, all of them "service" jobs, are lumped together with other service jobs, such as restaurant workers. However, the Federal Reserve's Flow of Funds reports do good job of showing us where debt has been created by borrowing in the Finance versus Industrial Economy. This helps us at least determine relative size of these parts of USA, Inc.'s business, and their importance.
This chart shows USA, Inc. taking on twice as much debt between 1996 and 2006, doubling from $14 trillion to $28 trillion. The debt taken on by its finance business grew more than three fold over the period, from nearly $4 trillion to nearly $14 trillion. Household debt also tripled, from just over $2 trillion to over $6 trillion. Total business debt in its industrial business, by contrast, grew more modestly from just over $2 trillion to just over $4 trillion.
The debt picture shows USA, Inc. as primarily a finance business. How relative employment? Which area of the business is providing the most jobs?
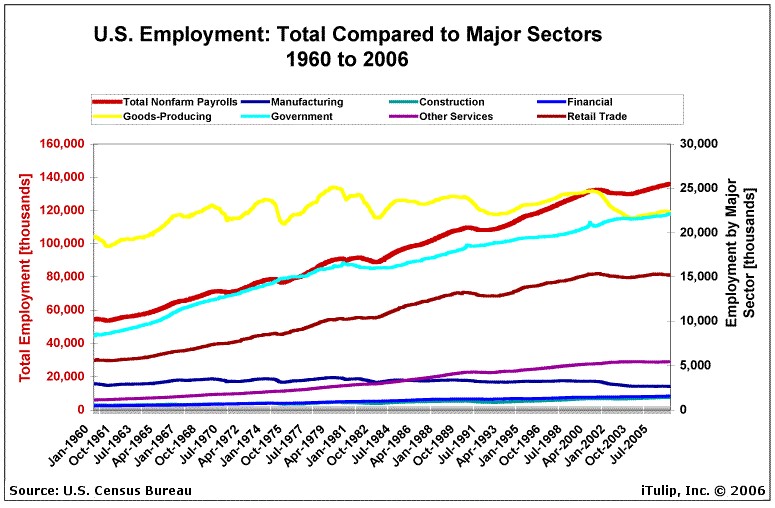
Above we see that of the 140 million jobs held by the "employees" of USA, Inc.–the taxpaying citizens of the U.S.–roughly 15 percent work in the traditional goods-producing industrial sector, down about 2.5 million jobs since the start of the economic "recovery" in 2001. The largest area for employment growth since then is the government, now at 23 million jobs, equal to the goods-producing segment. The third largest employer is retail trade, providing 15 million jobs. Manufacturing, on the bottom of the chart, employs a meager 2.5 million citizens out of 140 million.
Is retail trade part of the Finance Economy or the Industrial Economy? Unfortunately, for our analytical purposes, the BLS data retail trade as part of both the finance and the industrial economy, so it's hard to say how many jobs the finance part of USA, Inc.'s business produces. Problem is, the BLS still measures the U.S. economy as if it were an industrial economy, even though the debt picture clearly shows that finance dominates. The number of jobs created by finance operations is small in proportion of debt that USA, Inc. takes on for finance. We can infer that it generates a small number of higher paying jobs.
In terms of debt, USA, Inc. is a finance business first, a government business second, and an industrial business third. In terms of employment, USA, Inc. appears to be an industrial business first, a government business second, and a finance business third, but it is difficult to say because of the way the data are collected and reported. USA, Inc. appears to be more of a non labor-intensive Finance Economy than a labor-intensive Industrial Economy. This may help explain the unusually tepid job growth in the current economic recovery compared to previous recoveries, as shown below.
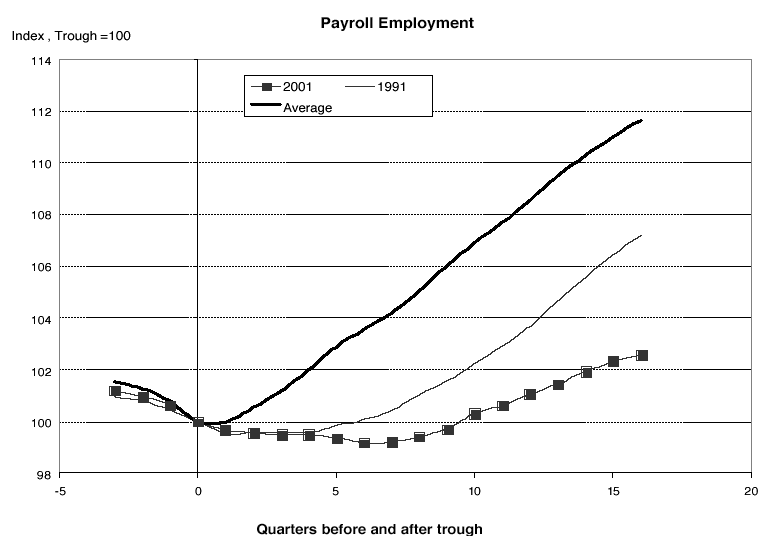
Source: Northern Trust
How about USA, Inc.'s financial situation? We all know that U.S.A., Inc. runs in the red. We read about the trade and fiscal deficits frequently. Here is the ratio of total debt outstanding compared to annual GDP.

We see that while GDP nearly tripled from over $4 trillion to over $11 trillion between 1974 and 2006, total debt outstanding increased by a factor of 13, from just over $2 trillion to over $28 trillion. In other words, in 1974 $0.50 of new debt was needed to fund $1 of GDP, but by 2006 about $2 of debt was required to fund $1 of GDP.
If your company had to borrow $2 for every $1 of income it generated, how would your investors feel about your business? If the trend continued and for some reason your business stopped growing, or even contracted, investors are going to want to sell your stock.
In the case of USA, Inc. a share of common stock in USA, Inc. is the U.S. dollar. So far, investors have not sold, in spite of the Company's unattractive financial position. Instead, investors keep lending the company more money, much the way venture capitalists will sometimes continue to invest more money into a company that is losing money in the short term, either because they believe the company will turn around and be a big success long term or because the political consequences of allowing it to fail are untenable, or both. (VCs often find that when they allow a portfolio company to fail by withdrawing financial support, their VC firm follows if the company represents too big a write-down in their portfolio. This is the price of the error of making the initial investment, or of the VC's interference in the business later, or bad luck.)
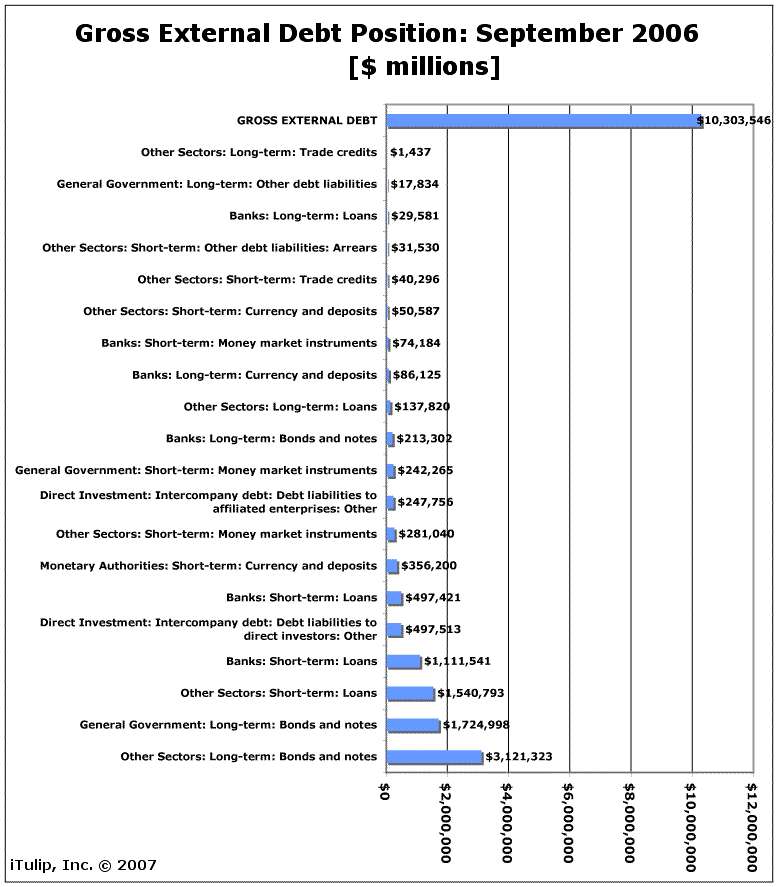
How much money has been lent to USA, Inc.? More than ten trillion is owed, about half as long- and half as short-term debt. Where has all this borrowed money coming from?
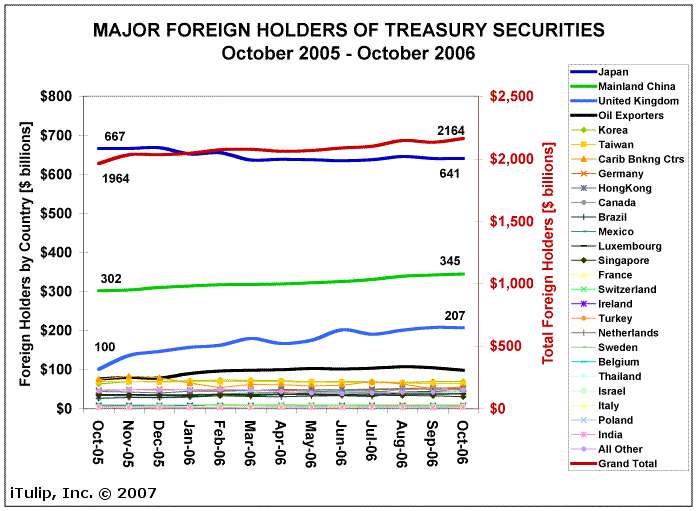
The chart above shows only $2.2 trillion in U.S. treasury debt out of the more than $10 trillion owed by USA, Inc. to the world, on net. The remainder of the debt is comprised mostly of agency and mortgage debt, more or less in proportion to treasury debt. China and Japan show up as the largest holders, although Japan has reduced its position recently. What may surprise readers is that the UK holds as many treasuries securities as they do, relative to the size of the UK economy. The UK doubled its holdings between October of 2005 and October 2006, making up all of the reduction in Japan's holdings.
What does USA, Inc. use this borrowed money for? The Company borrows not only to fund its trade deficit, the money it needs to buy products that USA, Inc. itself does not produce. USA, Inc. also borrows to fund ongoing operations, that is, the government, as well as the Industrial and especially the Finance sectors of its business. In 2003, for example, more than 70% of USA, Inc.s fiscal deficit was funded by foreign borrowing.
How likely is foreign lending to continue at this level? In recent years, foreign investment in long term U.S. debt has come less from private individual and institutional investors and more from foreign central banks. In 2006, for example, more than 80% of U.S. sovereign debt–treasury and agency debt–was purchased by foreign central banks, that is, by governments versus the private sector. These purchases, then, are government policy decisions, sometimes economic, sometimes political, and sometimes both. They are not expressions of free market preferences, votes of confidence in USA, Inc. by private foreign investors. Private investors got nervous about USA, Inc.'s finances a few years ago and have since then curtailed their purchases.
The reasons for foreign central banking purchases of USA, Inc. debt depend on the government in question. Purchases may be motivated by the desire to support a domestic economic policy of earned income from exports, as in the case of China. Others buy USA, Inc,. debt to pay for military "protection" that the country will otherwise have to fund directly, as Japan has done (and also to support export income). Others, such as the UK, lend largely for political reasons. In this way in particular a nation is not like a corporation; investments can be driven more by geopolitics than economics; that is a behavior you will not find in a pure business relationship. It is no accident that Taiwan, which is completely dependent on the U.S. for defense, is one of the largest lenders to USA, Inc. relative to GDP.
Lending over time correlates to a nation's level of interest in benefits that the U.S. has to offer that a country needs. Japan reduced her holdings just as a new government was voted in last year which ran on a platform of increased government spending on the military and reduced dependence on the U.S. for military protection. If Taiwan were suddenly to decide to cave in to Chinese demands for "re-unification," the country will no longer need to purchase so much U.S. debt, and USA, Inc. will have to find another country to make up the difference. (As explained in Forbidden Nation: The History Of Taiwan , Taiwan has been a sovereign state off and on for centuries, and is today one in all but name, so this is unlikely.) As you can see, geopolitics has become the number one determinant of the funding of USA, Inc.'s business, and thus-because it runs in the red–a continuous supply of fresh lending is critical in order to the Company to function as a going concern. Changes in geopolitical balance between the U.S. and its trade partners, and among its partners and adversaries with each other, result in increases or reductions in demand for USA, Inc's financial assets. The resulting changes in such economic variables as value of the dollar, mortgage rates, and inflation can lead to profound and perhaps sudden changes in the U.S. economy.
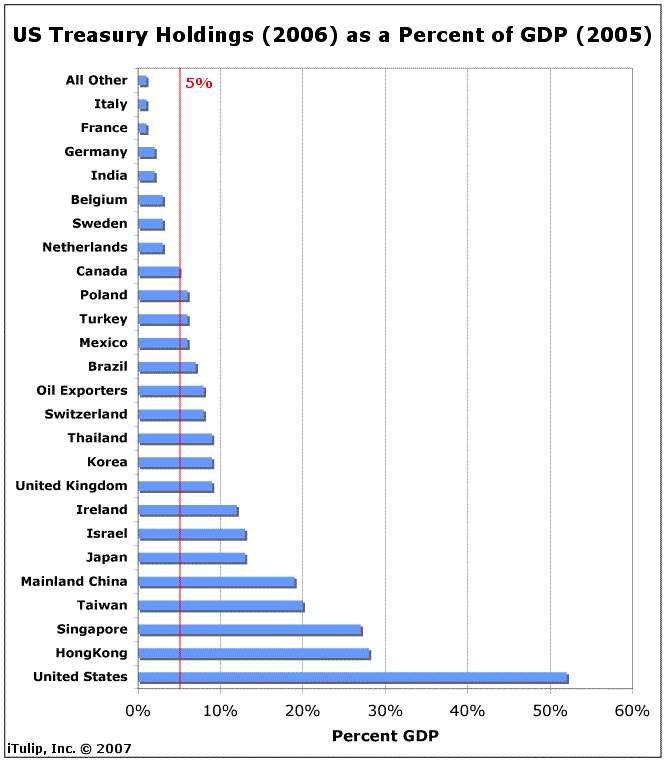
A measure of who needs USA, Inc's "help" shows up more clearly when you rank lending in proportion to GDP, above. (For a more accurate picture, we'd ideally use economic surplus instead of GDP and will post that chart later. That will more clearly show the extent to which recycling of dollars earned from export contributes to a central banks' purchases of treasuries in order to balance the resulting demand on their own currency, thus preventing their currency from appreciating.) The first observation is that, contrary to what you often read, while China and Japan have lent USA, Inc. a lot of money they are not the biggest lenders relative to GDP. Note how little Rummy's "old Europe" has lent. Germany, Italy, France are all negligible holders of long term USA, Inc. notes. We are often told that the attraction of U.S. sovereign debt is the transparency, liquidity, and depth of the U.S. debt markets. Readers might ask why this benefit applies to China and oil producers but not, apparently, to Germany, France, Italy, the Netherlands, and so on. The implication is critical. The lending lightweights were not big fans of the U.S. led War in Iraq. Also note the conspicuous absence of Russia as a line item in the report. Presumably Russia is, perhaps ignominiously, lumped together with "Oil Producers." Singapore's and Hong Kong's heavy lending relative to GDP is a mystery until you dig into the details; Hong Kong banking centers are where many transfers happen on behalf of China, and Singapore does a lot of banking for China as well.
USA, Inc. is a finance business that depends on foreign lending by interested foreign governments making economic and geopolitical decisions. It needs $2 of debt to produce $1 GDP. How about the future value of its common shares, the U.S. dollar?
First, how many shares of USA, Inc. has the company issued? The closest equivalent to "fully diluted shares" for our analogy is the statistic most popular with the Fed itself to measure USA, Inc.'s money supply, Money at Zero Maturity, of MZM.
As you can see, for many years the money supply MZM grew at more or less the same rate as the economy. This is logical. An economy needs more money as it grows, but there is no apparent reason why an economy needs its money supply to grow significantly faster than GDP. The ratio of MZM to GDP held steady at a ratio of about one dollar of MZM for every ten dollars of GDP. But starting in 1971, after the USA, Inc. went off the gold standard, MZM started to grow at roughly 8% a year while USA, Inc. itself grew on average 3% per year, so that by 2006 the ratio grew from 1:10 to nearly 1:2. Current course and speed, by 2015 the money supply measured as MZM will equal the entire economic output of the nation. There is no ideal ratio of money supply to GDP, but think of what might happen to the value of General Motors stock if the company grew 3% a year while issuing another 8% more stock annually.
USA, Inc. has a lot of debt, needs to do a lot of new borrowing from foreign central banks to buy products and services and fund operations, and has issued more stock recently than its historical growth rate justifies. Companies in better financial shape than USA, Inc. have been forced to buy their own stock back cheap when something happened to suddenly slow growth and frighten investors.
The "What, me worry" argument for USA, Inc.'s finances and its currency, the dollar, enjoys a special property, unlike other companies' stock. Dollars are a reserve currency, which means there is demand for dollars not only when goods are purchased from the Company but even when certain goods, such as oil, are exchanged between third parties. Oil, for example, is mostly denominated in dollars; when Japan buys oil from Saudi Arabia, it needs to use dollars from its accounts or go onto the foreign exchange markets to buy them for the transaction. Also, when a foreign central bank buys USA, Inc. debt, it must sell its own currency and buy dollars. Conversely, when they sell, more dollars go onto the foreign exchange markets, increasing the supply and lowering the dollar's value if there is not purchasing at the same time to offset the increase in supply.
Those who worry that the dollar might sell off are usually offered the reassurance that if foreign central banks sell USA, Inc. debt, the value of the remaining dollars in their accounts will decline. Selling hurts them, so they won't do it. That's like saying a major holder of GMGI stock, which peaked at $137 in December 1999, will not sell because selling will cause the holder's remaining shares to lose value. But that is not how markets operate, even government supported markets.
CMGI stock is trading at $1.27 today. USA, Inc. is not CMGI, so a 90% decline in the dollar is not in the cards. Nor is USA, Inc., General Motors, whose stock was at 93 as recently as 1999 and is trading at 36 today. USA, Inc. is more like Microsoft, but with a monopoly on its major product, military power, in decline, and its monopoly on its reserve currency "stock" under pressure from other currencies, especially the euro.
USA, Inc., unlike a traditional company, depends on the economic and geopolitical interest of foreign governments. It is vulnerable to changes in either or both. Players on the periphery of the system, such as Russia, are talking about diversifying out of dollars for third party transactions. The level of geopolitical tension between the U.S. and Russia appears to be rising at the same time. This may be coincidental, or maybe not. A simultaneous move by several governments away from transactions in dollars and purchases of U.S. financial assets puts further pressure on the main players–China, Japan, and the UK–to pick up the slack. Now China is talking in public about diversifying out of dollars.
How does all of this impact the employees of USA, Inc., the U.S. taxpayer? Let's look at the result of a Finance Economy dependent on foreign central bank borrowing and rapid money supply growth.

As USA, Inc. got out of the industrial economic business and grew its finance and government businesses, salaries to employees (income to citizens) become dramatically skewed. As you can see above, back when USA, Inc. was primarily an Industrial Economy, income gains were more or less evenly distributed across income brackets. As USA, Inc. developed into mostly a finance business since 1979, most of the income gains were concentrated in the top 5% income bracket. What about net worth, the sum of assets and liabilities on each employee's household balance sheet?
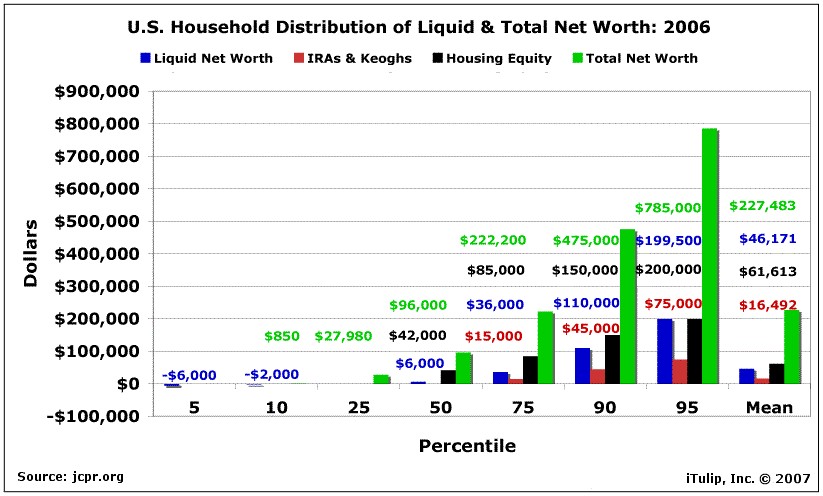
This chart shows the distribution of liquid net worth, IRAs and Keoghs, housing equity, and total net worth in the HRS. All values are in 1992 dollars. Liquid net worth is the sum of checking and saving accounts, bonds, stocks, and other assets, minus short-term debt. Total net worth is the sum of liquid net worth, IRAs and Keoghs, housing equity, other real estate, business equity, and vehicles. The number of observations is 5,292. Figures are weighted using survey weights.
Debt levels relative to net worth have grown for all wealth classes except the top 1%. It is lower for the bottom 40%, but that means that instead of 19 times net worth, debt is down to 15 times net worth.
The net worth of the top 5% is now three times the mean. You can also calculate that as there are 110 million households in the U.S., that the combined net worth of all U.S. households is $24 trillion, or equal to about two times annual GDP. That sounds like a healthy number. Unfortunately, according to David M. Walker, Comptroller General of the United States (USA, Inc.'s controller), the Company's total liabilities and unfunded commitments are now $50 trillion, up from $20 trillion only six years ago, or $440,000 per household (see "America’s Red Ink," The Washington Post, 24 December 2006).
The "employees" of the company, who are creating all the wealth through their efforts, are actually receiving less and less of the revenue that the Company is generating. "Management" is getting more and more. The company's stock, the U.S. dollar, is declining in purchasing power; even the purchasing power of the money they earn is also declining.
The apologists for this state of affairs say that as long as foreign central banks are willing to keep buying, what's the problem? Maybe it is a matter of optimism versus caution. When I build a business, I aim to get the company to profitability as soon as possible. The reason is that when you are running in the red, you are vulnerable to all kinds of shocks, many of them outside your control. A competitor might suddenly burst on the scene with a killer product and steal your biggest customers. Demand in your industry can turn down, as happened in the high technology industry in the early 2000s. The macro-economy can turn on you, causing a decline in demand generally.
As the percent of income that USA, Inc. needs to borrow in order to operate and buy goods to fund purchases and operations extends farther beyond a "safe" threshold of 5%–currently around 6.5%–new loans will become harder to come by. U.S.A., Inc. becomes ever more vulnerable to shocks. All that the Company needs to get into serious trouble is for an event to cause U.S.A., Inc. to have a couple of bad quarters. A derivatives-based financial crisis that drives lenders toward alternative reserve currencies. A failed military adventure that erodes the U.S. monopoly on military power.
To the left is a picture of a sticker I picked up in Taipei not long after the U.S. engaged Afghanistan in 2001. It reflects a perception of America which the U.S. carefully cultivates. This makes any show of weakness, either military or economic, a major liability.
Watch for strains on the U.S. monopolies in the form of challenges to U.S. military and economic supremacy by Russia, China, Iran, and Venezuela. These countries are developing an alliance to lessen their dependence on the U.S. for export demand, secure natural resources, and otherwise act more in their own versus the U.S.'s interests. They form the core of a new economic, political, and military trade block that has the potential to evolve into a force that can challenge U.S. military and dollar hegemony. The litmus test for the survival and success of this alliance is Australia; if Australia breaks with the U.S. for China, that likely marks the beginning of the end of U.S. global military and economic unilateralism. Note that the financial markets will move on rumors in these areas and recover on fact. When we get a big move in the stock indexes that looks like it may become self-reinforcing, look out below. And if that happens you can fully expect the shareholders and employees to demand a complete change in management. They will likely vote in new management to help employees with increased option grants (taxes), increased salaries (inflation), health care plans, and other benefits.
My next piece will cover how a combined contraction in USA, Inc.'s debt and a decline in the value of of its stock, the dollar, might play out.
__________________________________________________
Special iTulip discounted subscription and pay services flogged here:
For a book that explains iTulip concepts in simple terms americasbubbleeconomy
For the safest, lowest cost way to buy and trade gold, see The Bullionvault
To receive the iTulip Newsletter or iTulip Alerts, Join our FREE Email Mailing List
Copyright � iTulip, Inc. 1998 - 2007 All Rights Reserved
All information provided "as is" for informational purposes only, not intended for trading purposes or advice. Nothing appearing on this website should be considered a recommendation to buy or to sell any security or related financial instrument. iTulip, Inc. is not liable for any informational errors, incompleteness, or delays, or for any actions taken in reliance on information contained herein. Full Disclaimer
by Eric Janszen
"The economy is robust," says one newspaper headline. Another reads, "U.S. household savings rate lower than since the Great Depression." Then you read, "Number of U.S. millionaires at all time record." Then, "Millions of households drowning in debt," and "Real wages declined 13 percent in past decade" and, "Unemployment at all time lows."
It just doesn't add up. Let's see if we can't make some sense out of all of these apparently contradictory reports, what it all means and where it is headed.
Dr. Michael Hudson explains in a recent iTulip.com article "Saving, Asset-Price Inflation, and Debt-Induced Deflation," that the U.S. economy is composed of two economies. One is the traditional Industrial Economy engaged in production and consumption of goods and services. This is the economy that economists typically talk about, the one that you see reported in the papers. The other economy is the Finance Economy, sometimes referred to by economists as Finance, Insurance and Real Estate or "FIRE Economy."
Both economies are heavily influenced by the government. Here is Dr. Hudson's diagram of the total economy.
A lot of readers are, like me, business people who find the economy easier to understand as a business discussed in concrete terms, rather than as an abstraction viewed in theoretical terms the way most economists tend to think and talk about it.
For today, let's refer to the multi-segment U.S. economy, comprised of a FIRE Economy and an Industrial Economy, as a company called USA, Inc. To understand the business of USA, Inc., we start by looking at the relative size of each of these two components.
We often read that USA, Inc. is not a production-consumption business. Instead, it has over the years become a "service" business. But is that really true? The question comes down to this: which parts of the economy are generating the most revenue (GDP), for whom, and how many jobs?
We can use the Bureau of Labored Statistics' (BLS) employment data to help figure out proportions of different sectors of the economy, but unfortunately employment data are not collected and reported in a way that makes the Finance Economy's and Industrial Economy's relative contributions to employment simple to determine. Finance Economy jobs, all of them "service" jobs, are lumped together with other service jobs, such as restaurant workers. However, the Federal Reserve's Flow of Funds reports do good job of showing us where debt has been created by borrowing in the Finance versus Industrial Economy. This helps us at least determine relative size of these parts of USA, Inc.'s business, and their importance.
This chart shows USA, Inc. taking on twice as much debt between 1996 and 2006, doubling from $14 trillion to $28 trillion. The debt taken on by its finance business grew more than three fold over the period, from nearly $4 trillion to nearly $14 trillion. Household debt also tripled, from just over $2 trillion to over $6 trillion. Total business debt in its industrial business, by contrast, grew more modestly from just over $2 trillion to just over $4 trillion.
The debt picture shows USA, Inc. as primarily a finance business. How relative employment? Which area of the business is providing the most jobs?
Above we see that of the 140 million jobs held by the "employees" of USA, Inc.–the taxpaying citizens of the U.S.–roughly 15 percent work in the traditional goods-producing industrial sector, down about 2.5 million jobs since the start of the economic "recovery" in 2001. The largest area for employment growth since then is the government, now at 23 million jobs, equal to the goods-producing segment. The third largest employer is retail trade, providing 15 million jobs. Manufacturing, on the bottom of the chart, employs a meager 2.5 million citizens out of 140 million.
Is retail trade part of the Finance Economy or the Industrial Economy? Unfortunately, for our analytical purposes, the BLS data retail trade as part of both the finance and the industrial economy, so it's hard to say how many jobs the finance part of USA, Inc.'s business produces. Problem is, the BLS still measures the U.S. economy as if it were an industrial economy, even though the debt picture clearly shows that finance dominates. The number of jobs created by finance operations is small in proportion of debt that USA, Inc. takes on for finance. We can infer that it generates a small number of higher paying jobs.
In terms of debt, USA, Inc. is a finance business first, a government business second, and an industrial business third. In terms of employment, USA, Inc. appears to be an industrial business first, a government business second, and a finance business third, but it is difficult to say because of the way the data are collected and reported. USA, Inc. appears to be more of a non labor-intensive Finance Economy than a labor-intensive Industrial Economy. This may help explain the unusually tepid job growth in the current economic recovery compared to previous recoveries, as shown below.
Source: Northern Trust
How about USA, Inc.'s financial situation? We all know that U.S.A., Inc. runs in the red. We read about the trade and fiscal deficits frequently. Here is the ratio of total debt outstanding compared to annual GDP.
We see that while GDP nearly tripled from over $4 trillion to over $11 trillion between 1974 and 2006, total debt outstanding increased by a factor of 13, from just over $2 trillion to over $28 trillion. In other words, in 1974 $0.50 of new debt was needed to fund $1 of GDP, but by 2006 about $2 of debt was required to fund $1 of GDP.
If your company had to borrow $2 for every $1 of income it generated, how would your investors feel about your business? If the trend continued and for some reason your business stopped growing, or even contracted, investors are going to want to sell your stock.
In the case of USA, Inc. a share of common stock in USA, Inc. is the U.S. dollar. So far, investors have not sold, in spite of the Company's unattractive financial position. Instead, investors keep lending the company more money, much the way venture capitalists will sometimes continue to invest more money into a company that is losing money in the short term, either because they believe the company will turn around and be a big success long term or because the political consequences of allowing it to fail are untenable, or both. (VCs often find that when they allow a portfolio company to fail by withdrawing financial support, their VC firm follows if the company represents too big a write-down in their portfolio. This is the price of the error of making the initial investment, or of the VC's interference in the business later, or bad luck.)
How much money has been lent to USA, Inc.? More than ten trillion is owed, about half as long- and half as short-term debt. Where has all this borrowed money coming from?
The chart above shows only $2.2 trillion in U.S. treasury debt out of the more than $10 trillion owed by USA, Inc. to the world, on net. The remainder of the debt is comprised mostly of agency and mortgage debt, more or less in proportion to treasury debt. China and Japan show up as the largest holders, although Japan has reduced its position recently. What may surprise readers is that the UK holds as many treasuries securities as they do, relative to the size of the UK economy. The UK doubled its holdings between October of 2005 and October 2006, making up all of the reduction in Japan's holdings.
What does USA, Inc. use this borrowed money for? The Company borrows not only to fund its trade deficit, the money it needs to buy products that USA, Inc. itself does not produce. USA, Inc. also borrows to fund ongoing operations, that is, the government, as well as the Industrial and especially the Finance sectors of its business. In 2003, for example, more than 70% of USA, Inc.s fiscal deficit was funded by foreign borrowing.
How likely is foreign lending to continue at this level? In recent years, foreign investment in long term U.S. debt has come less from private individual and institutional investors and more from foreign central banks. In 2006, for example, more than 80% of U.S. sovereign debt–treasury and agency debt–was purchased by foreign central banks, that is, by governments versus the private sector. These purchases, then, are government policy decisions, sometimes economic, sometimes political, and sometimes both. They are not expressions of free market preferences, votes of confidence in USA, Inc. by private foreign investors. Private investors got nervous about USA, Inc.'s finances a few years ago and have since then curtailed their purchases.
The reasons for foreign central banking purchases of USA, Inc. debt depend on the government in question. Purchases may be motivated by the desire to support a domestic economic policy of earned income from exports, as in the case of China. Others buy USA, Inc,. debt to pay for military "protection" that the country will otherwise have to fund directly, as Japan has done (and also to support export income). Others, such as the UK, lend largely for political reasons. In this way in particular a nation is not like a corporation; investments can be driven more by geopolitics than economics; that is a behavior you will not find in a pure business relationship. It is no accident that Taiwan, which is completely dependent on the U.S. for defense, is one of the largest lenders to USA, Inc. relative to GDP.
Lending over time correlates to a nation's level of interest in benefits that the U.S. has to offer that a country needs. Japan reduced her holdings just as a new government was voted in last year which ran on a platform of increased government spending on the military and reduced dependence on the U.S. for military protection. If Taiwan were suddenly to decide to cave in to Chinese demands for "re-unification," the country will no longer need to purchase so much U.S. debt, and USA, Inc. will have to find another country to make up the difference. (As explained in Forbidden Nation: The History Of Taiwan
, Taiwan has been a sovereign state off and on for centuries, and is today one in all but name, so this is unlikely.) As you can see, geopolitics has become the number one determinant of the funding of USA, Inc.'s business, and thus-because it runs in the red–a continuous supply of fresh lending is critical in order to the Company to function as a going concern. Changes in geopolitical balance between the U.S. and its trade partners, and among its partners and adversaries with each other, result in increases or reductions in demand for USA, Inc's financial assets. The resulting changes in such economic variables as value of the dollar, mortgage rates, and inflation can lead to profound and perhaps sudden changes in the U.S. economy.A measure of who needs USA, Inc's "help" shows up more clearly when you rank lending in proportion to GDP, above. (For a more accurate picture, we'd ideally use economic surplus instead of GDP and will post that chart later. That will more clearly show the extent to which recycling of dollars earned from export contributes to a central banks' purchases of treasuries in order to balance the resulting demand on their own currency, thus preventing their currency from appreciating.) The first observation is that, contrary to what you often read, while China and Japan have lent USA, Inc. a lot of money they are not the biggest lenders relative to GDP. Note how little Rummy's "old Europe" has lent. Germany, Italy, France are all negligible holders of long term USA, Inc. notes. We are often told that the attraction of U.S. sovereign debt is the transparency, liquidity, and depth of the U.S. debt markets. Readers might ask why this benefit applies to China and oil producers but not, apparently, to Germany, France, Italy, the Netherlands, and so on. The implication is critical. The lending lightweights were not big fans of the U.S. led War in Iraq. Also note the conspicuous absence of Russia as a line item in the report. Presumably Russia is, perhaps ignominiously, lumped together with "Oil Producers." Singapore's and Hong Kong's heavy lending relative to GDP is a mystery until you dig into the details; Hong Kong banking centers are where many transfers happen on behalf of China, and Singapore does a lot of banking for China as well.
USA, Inc. is a finance business that depends on foreign lending by interested foreign governments making economic and geopolitical decisions. It needs $2 of debt to produce $1 GDP. How about the future value of its common shares, the U.S. dollar?
First, how many shares of USA, Inc. has the company issued? The closest equivalent to "fully diluted shares" for our analogy is the statistic most popular with the Fed itself to measure USA, Inc.'s money supply, Money at Zero Maturity, of MZM.
As you can see, for many years the money supply MZM grew at more or less the same rate as the economy. This is logical. An economy needs more money as it grows, but there is no apparent reason why an economy needs its money supply to grow significantly faster than GDP. The ratio of MZM to GDP held steady at a ratio of about one dollar of MZM for every ten dollars of GDP. But starting in 1971, after the USA, Inc. went off the gold standard, MZM started to grow at roughly 8% a year while USA, Inc. itself grew on average 3% per year, so that by 2006 the ratio grew from 1:10 to nearly 1:2. Current course and speed, by 2015 the money supply measured as MZM will equal the entire economic output of the nation. There is no ideal ratio of money supply to GDP, but think of what might happen to the value of General Motors stock if the company grew 3% a year while issuing another 8% more stock annually.
USA, Inc. has a lot of debt, needs to do a lot of new borrowing from foreign central banks to buy products and services and fund operations, and has issued more stock recently than its historical growth rate justifies. Companies in better financial shape than USA, Inc. have been forced to buy their own stock back cheap when something happened to suddenly slow growth and frighten investors.
The "What, me worry" argument for USA, Inc.'s finances and its currency, the dollar, enjoys a special property, unlike other companies' stock. Dollars are a reserve currency, which means there is demand for dollars not only when goods are purchased from the Company but even when certain goods, such as oil, are exchanged between third parties. Oil, for example, is mostly denominated in dollars; when Japan buys oil from Saudi Arabia, it needs to use dollars from its accounts or go onto the foreign exchange markets to buy them for the transaction. Also, when a foreign central bank buys USA, Inc. debt, it must sell its own currency and buy dollars. Conversely, when they sell, more dollars go onto the foreign exchange markets, increasing the supply and lowering the dollar's value if there is not purchasing at the same time to offset the increase in supply.
Those who worry that the dollar might sell off are usually offered the reassurance that if foreign central banks sell USA, Inc. debt, the value of the remaining dollars in their accounts will decline. Selling hurts them, so they won't do it. That's like saying a major holder of GMGI stock, which peaked at $137 in December 1999, will not sell because selling will cause the holder's remaining shares to lose value. But that is not how markets operate, even government supported markets.
CMGI stock is trading at $1.27 today. USA, Inc. is not CMGI, so a 90% decline in the dollar is not in the cards. Nor is USA, Inc., General Motors, whose stock was at 93 as recently as 1999 and is trading at 36 today. USA, Inc. is more like Microsoft, but with a monopoly on its major product, military power, in decline, and its monopoly on its reserve currency "stock" under pressure from other currencies, especially the euro.
USA, Inc., unlike a traditional company, depends on the economic and geopolitical interest of foreign governments. It is vulnerable to changes in either or both. Players on the periphery of the system, such as Russia, are talking about diversifying out of dollars for third party transactions. The level of geopolitical tension between the U.S. and Russia appears to be rising at the same time. This may be coincidental, or maybe not. A simultaneous move by several governments away from transactions in dollars and purchases of U.S. financial assets puts further pressure on the main players–China, Japan, and the UK–to pick up the slack. Now China is talking in public about diversifying out of dollars.
How does all of this impact the employees of USA, Inc., the U.S. taxpayer? Let's look at the result of a Finance Economy dependent on foreign central bank borrowing and rapid money supply growth.
As USA, Inc. got out of the industrial economic business and grew its finance and government businesses, salaries to employees (income to citizens) become dramatically skewed. As you can see above, back when USA, Inc. was primarily an Industrial Economy, income gains were more or less evenly distributed across income brackets. As USA, Inc. developed into mostly a finance business since 1979, most of the income gains were concentrated in the top 5% income bracket. What about net worth, the sum of assets and liabilities on each employee's household balance sheet?
Debt levels relative to net worth have grown for all wealth classes except the top 1%. It is lower for the bottom 40%, but that means that instead of 19 times net worth, debt is down to 15 times net worth.
The net worth of the top 5% is now three times the mean. You can also calculate that as there are 110 million households in the U.S., that the combined net worth of all U.S. households is $24 trillion, or equal to about two times annual GDP. That sounds like a healthy number. Unfortunately, according to David M. Walker, Comptroller General of the United States (USA, Inc.'s controller), the Company's total liabilities and unfunded commitments are now $50 trillion, up from $20 trillion only six years ago, or $440,000 per household (see "America’s Red Ink," The Washington Post, 24 December 2006).
The "employees" of the company, who are creating all the wealth through their efforts, are actually receiving less and less of the revenue that the Company is generating. "Management" is getting more and more. The company's stock, the U.S. dollar, is declining in purchasing power; even the purchasing power of the money they earn is also declining.
The apologists for this state of affairs say that as long as foreign central banks are willing to keep buying, what's the problem? Maybe it is a matter of optimism versus caution. When I build a business, I aim to get the company to profitability as soon as possible. The reason is that when you are running in the red, you are vulnerable to all kinds of shocks, many of them outside your control. A competitor might suddenly burst on the scene with a killer product and steal your biggest customers. Demand in your industry can turn down, as happened in the high technology industry in the early 2000s. The macro-economy can turn on you, causing a decline in demand generally.
As the percent of income that USA, Inc. needs to borrow in order to operate and buy goods to fund purchases and operations extends farther beyond a "safe" threshold of 5%–currently around 6.5%–new loans will become harder to come by. U.S.A., Inc. becomes ever more vulnerable to shocks. All that the Company needs to get into serious trouble is for an event to cause U.S.A., Inc. to have a couple of bad quarters. A derivatives-based financial crisis that drives lenders toward alternative reserve currencies. A failed military adventure that erodes the U.S. monopoly on military power.
 |
Watch for strains on the U.S. monopolies in the form of challenges to U.S. military and economic supremacy by Russia, China, Iran, and Venezuela. These countries are developing an alliance to lessen their dependence on the U.S. for export demand, secure natural resources, and otherwise act more in their own versus the U.S.'s interests. They form the core of a new economic, political, and military trade block that has the potential to evolve into a force that can challenge U.S. military and dollar hegemony. The litmus test for the survival and success of this alliance is Australia; if Australia breaks with the U.S. for China, that likely marks the beginning of the end of U.S. global military and economic unilateralism. Note that the financial markets will move on rumors in these areas and recover on fact. When we get a big move in the stock indexes that looks like it may become self-reinforcing, look out below. And if that happens you can fully expect the shareholders and employees to demand a complete change in management. They will likely vote in new management to help employees with increased option grants (taxes), increased salaries (inflation), health care plans, and other benefits.
My next piece will cover how a combined contraction in USA, Inc.'s debt and a decline in the value of of its stock, the dollar, might play out.
__________________________________________________
Special iTulip discounted subscription and pay services flogged here:
For a book that explains iTulip concepts in simple terms americasbubbleeconomy
For the safest, lowest cost way to buy and trade gold, see The Bullionvault
To receive the iTulip Newsletter or iTulip Alerts, Join our FREE Email Mailing List
Copyright � iTulip, Inc. 1998 - 2007 All Rights Reserved
All information provided "as is" for informational purposes only, not intended for trading purposes or advice. Nothing appearing on this website should be considered a recommendation to buy or to sell any security or related financial instrument. iTulip, Inc. is not liable for any informational errors, incompleteness, or delays, or for any actions taken in reliance on information contained herein. Full Disclaimer
 Dad is sooo proud of me.

Comment