 Tweet
Tweet
2013 Review and 2014 Forecast - Part I: The Last Bubble

Photo Credit: Glenn Cantor
� Stock market crash, right on schedule. Time to Short?
� Is the Yellen Fed doing a Roy Young?
� China's Great Wall of Money crumbles. Who will be America's IMF this time?
� Why do they call them Emerging Markets? Because it's hard to get your money out in an Emergency.
� Gold says, "I'm not dead yet!"
What? You thought it could go on forever? The asset bubbles and re-bubbles and re-re-bubbles?
How many times can your reflate a torn up rubber raft?
Time to chuck it out and get a new one.
Except that there isn't a new one. This is it. The only one we got and we're all in it together.
And, gosh, looking back on it, over the past 20 years, maybe we shouldn't have taken it through Class V rapids twice loaded with beer kegs.
But here we are, cheek to cowl, in this giant, flaccid, half inflated economy, damage from the last two runs shoddily patched, headed over the rapids again. Without so much as a roll of duct tape.
While the usual bearish crowd was busy capitulating over the past six months and calling for continued growth and a good year for the markets in 2014, maybe not as booming great as 2013, I've been following the data and it takes me to a different place, to an epic and virtually unstoppable calamity.
Not that I didn't try to build an optimistic case to counter my June 2013 forecast The Post-Market Economy � Part II: The Crash of 2014, it's just that the data kept dragging me off that run.
The ineludible obstacle in the path of any hopeful line of argument is the fact that the current recovery from the 2008 credit crisis that followed from the condition of over-indebtedness and risk-polluted credit markets has since 2009 been achieved by means of credit inflation which has produced even greater over-indebtedness.
Credit risk pollution, rather than pooled in an obscure corner of the credit markets and seeping into the global financial system by way of pension funds, this time around has been injected into the foundation of the endogenous credit structure by means of the Fed's "yield curve shaping," a polite term used by academics in place of the rude but more truthful term "long-bond price fixing."
I don't blame anyone for wanting to turn and look the other way. God knows we've been through enough, especially those citizens of the world who have not benefited from the regressive reflation policies of central banks. These have primarily benefitted the asset holding classes. A recent Gallup poll reveals 58% of Americans think the economy is getting worse, and I doubt they are in any mood to hear bad news about the future. Economic doomertainment is out of fashion, and that fact alone tells you that popular sentiment is still dower. In hard times, American Idol-type hopertainment makes a comeback.
It's not all bad news. Fortress America economic and policies are working their magic on the trade deficit, and are creating a beneficent spread between U.S. and world oil prices that is providing a big assist to the recovery. But to spy objects of economic beauty you have to crane your neck to see over the ugly fact that as recently as the year 2000 only $2.4 of new debt creation was needed to produce $1 of GDP growth and today that ratio is $4.6 to $1. Credit-financed growth is fun while it lasts, but historically has proved most miserable in reverse gear.
If you have a strong stomach and a firm grip, grab your helmet and jump in for a guided tour of the Last Bubble. But don't close your eyes. You can't read that way.
CI: Let's get right to it: the stock market. What happened in 2013 and what's in store for 2014? You noted the tops of the last two bubbles precisely, the first in March 2000 and the second November 2007. May 2011 you said the stock market was set to top-out at the end of 2013 then crash. Is it "Time to short" again?
EJ: The "time to short" calls in March 2000 and November 2007 were a luxury of knowing three things: 1) the process that was producing the asset bubble, 2) the events that were likely to end them, and 3) the monetary and fiscal policy response to the liquidity crisis, negative wealth effects, and recessions they produced. The difficulty with this particular asset price inflation -- I won't call it a "speculative bubble" because it isn't -- is that it was manufactured explicitly to produce positive wealth effects. It's the result of the Fed's large-scale long-bond price fixing operation known as QE.
That makes this asset price inflation fundamentally different than the previous two. The stock market has been about QE since late 2008 and is still about QE and, or of course, about Janet Yellen. The Bernanke Fed's policy of spurring aggregate demand with positive wealth effects using QE succeeded to a far greater extent than he's been given credit for. But it's a short-term fix, intended to "prime the pump" until the "engine of the economy" catches, or so goes the Keynesian model for counter-cyclical monetary policy. Philosophically it is in the traditional of the Keynesian reflation prescription of deficit spending, and it should be noted that whether the treasury bonds are on the Fed's or the Federal Government's balance sheet they are still claims on the real economy. In reality it's all fiscal stimulus. Whether the liability to the economy is on central bank or central government account will be a precious distinction when the cows come home.
CI: So... "Time to short?"
EJ: With respect timing of a correction, this second instantiation of the original asset bubble is as predictable as the previous two. The difficulty is that the nature of this asset price inflation is unlike the other two and without precedent. The trigger for the crash of this last and perhaps final asset inflation since 1995, well, I've been talking about that here for years. It ends with the Fed's misguided and arrogant bond price fixing operation and with the transition of the Fed chair position to Yellen. The question is do we get a more or less continuous mean regression to the sans-asset-inflation level as in 2000 and again in 2008 or something else.
CI: In 1999 your forecast for the NASDAQ crash was 80%, with no recovery to tear 2000 peak for ten years or more. In 2007 you said the S&P500 destined to correct 40% in 2008. This time?
EJ: The difficulty in forecasting the extent is lack of precedent. The market correction in 2008 resulted from the stock market pricing in the recession that the mortgage credit bubble collapse and American Financial Crisis (AFC) was causing. The 2008 correction process was roughly analogous to the Nikkei crash in 1990 that priced in the recession caused by the collapse of Japan's 1980s property bubble. My estimate of a 40% decline in the DJIA in 2008 was guided by that, and other inputs. But this asset inflation is without precedent, and the pre-conditions, too, are unique, so I think an estimate of the extent of decline is educated guesswork. My estimate in 2011 was for the early 2014 DJIA correction on the order of 60%, and I'll stick with that.
CI: Let's review that 2011 Real DJIA forecast.
EJ: In May of 2011 I saw the stock market coming out of the AFC in a second reflation of the original 1995 to 2000 asset bubble that motivated me to start iTulip in 1998. My forecast for the Real DJIA looked like this mid-2011. Basically I expected QE-fueled asset price inflation to carry the market up until the end of 2013.
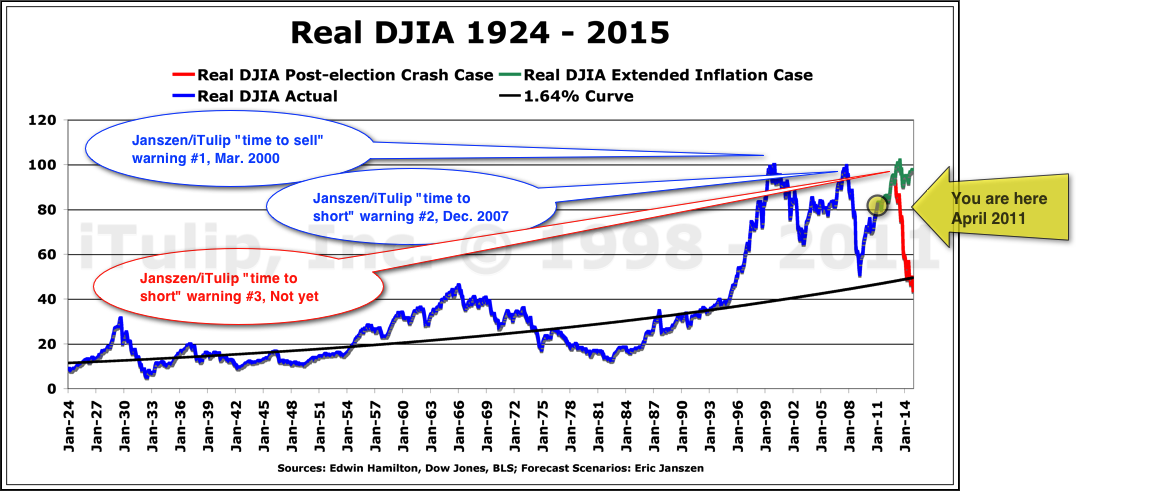
Forecast is for the inflation-adjusted Real DJIA to rise to slightly over 100 until the end of 2013.
A Dec. 30, 2013 update to the April 2011 chart, below.
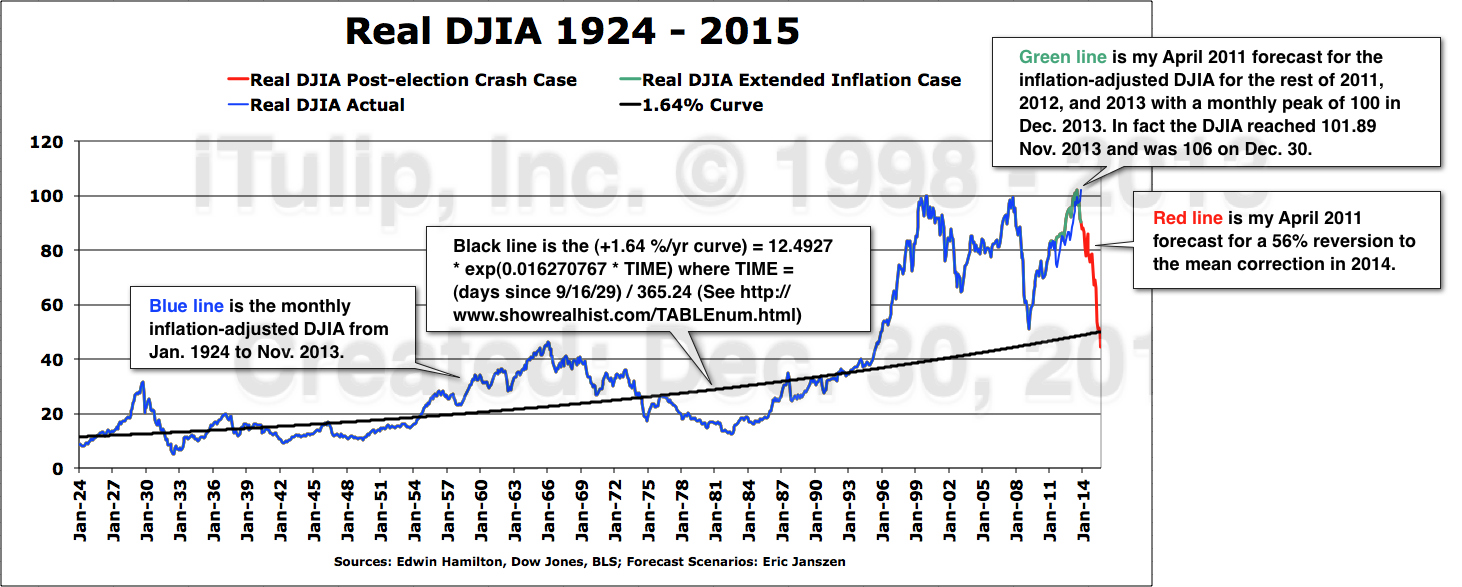
The Real DJIA reached just over 100 before starting to correct in Jan. 2014.
CI: This may be more than a correction, then? I mean, really? A 56% decline?
EJ: In mid-2011 I projected what I called the Extended Asset Price Inflation Case. That's the green line. The Real DJIA was to climb from 83 at the time to just over 100 by the end of 2013. Early in 2014 it begins to price-in a mid-gap recession later in the year. The first chart was published April 2011 as the watermark indicates. The update was generated from the same excel file. The DJIA data are from the Dow Jones & Co. and the inflation adjustments updated using the latest data from the Real DJIA web site that we've been using since 2006.
CI: So the crash you forecast in mid-2011 for early 2014 is happening? Wish you'd reminded me of this chart sooner!
EJ: That would appear to be the case. However, a crash of the full extent of 56% shown spells complete disaster for the U.S. economy. I seriously doubt that the Yellen Fed will stand by, or at least I hope they understand the danger. The correction is a delayed reaction to the beginning of the end of the Fed's bond price fixing operation, which ending I have warned for years was to produce chaos in the bond market as market participants thrashed around trying to figure out what the market price of a long bond is without the Fed's interference in the market. By the way, a member asked me about this in December in the Ask EJ section here, which is why the update has a Dec. 30, 2013 watermark on it.
CI: So why not short it? If you got the timing right.
EJ: I've found over the past 15 years that it pays to wait for the second break after the initial correction in a crash process, if that indeed what this is. There are cross-currents, such as capital flight from emerging markets into the U.S., possibly stronger than expected GDP and employment numbers for Q4 2013. That's why I'm reluctant to short it just yet. But I think it's a mistake to think that the declines in the indexes as normal market fretting over a transition to tighter monetary policy as the economy picks up. In Part II we take a closer look at additional indicators, such as VIX.
CI: Have you tried to build the case for that, for the market to correct, the "healthy correction" that everyone has been hoping for, followed by more gains as the economy picks up?
EJ: Yes but it's just not credible. The markets are far more precarious now than at any time since I started iTulip in 1998. At time of the peaks of the two speculative bubbles in 2000 and 2007, the over-priced assets at risk were confined to narrow classes of assets, the macro-economy was less fragile, inflation was higher, and so on, as I cover in the next part. Additionally the Fed has already used up interest rate policy as a anti-deflation policy tool. The Fed is now limited Zero Interest Rate Policy (ZIRP) options, namely, loading securities onto its balance sheet.
What if the Fed reverses taper and re-starts asset-price inflation? Only if the markets are convinced
that the Fed and Congress can via fresh stimulus can prevent the economy from falling back into recession.
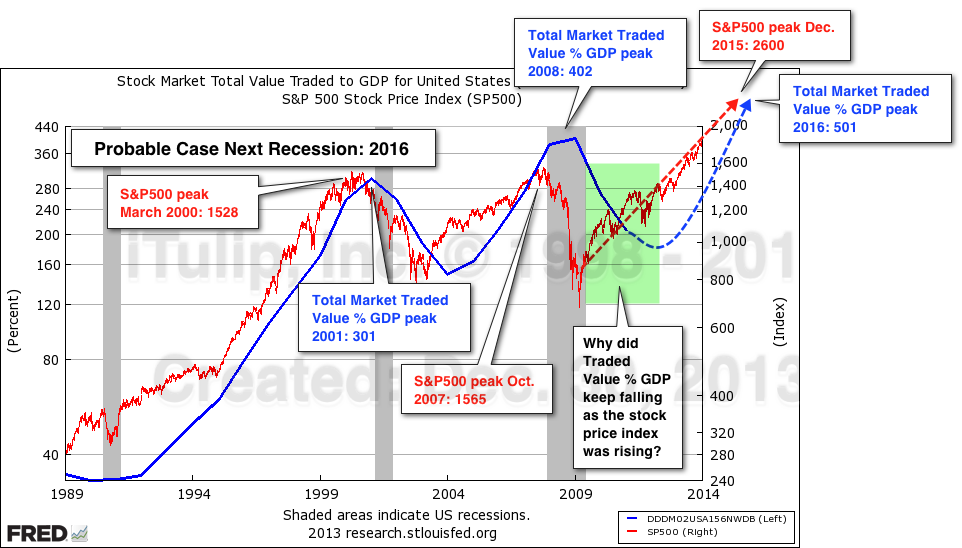
Traded Value percent GDP usually rises and fall with the market. This time firms used low yields to
issue debt and use the cash to buy back stock and propel prices upward, no trading involved.
CI: In 1998 and in 2006 "bubble or not" was hot topic of debate. Today seems like everyone thinks the markets are a bubble. Robert Shiller last week said he thought the stock market was a bubble but also said he was buying stocks anyway.
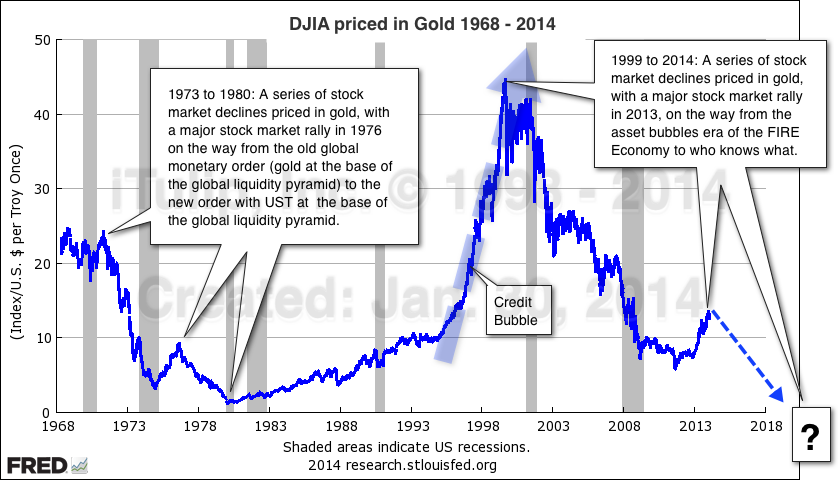
EJ: Which doesn't make much sense. Maybe he thinks it's reached a permanently high plateau. After working this problem since 1996 when I started to do research for iTulip before I launched it in 1998, my frame of reference is the sweep of the past 16 years. I don't see the markets today as a bubble but as a last-ditch, maybe final, effort to get the economy back to the inflated level it got to in 2000 as a result of an extraordinary infusion of credit into the economy around 1994.
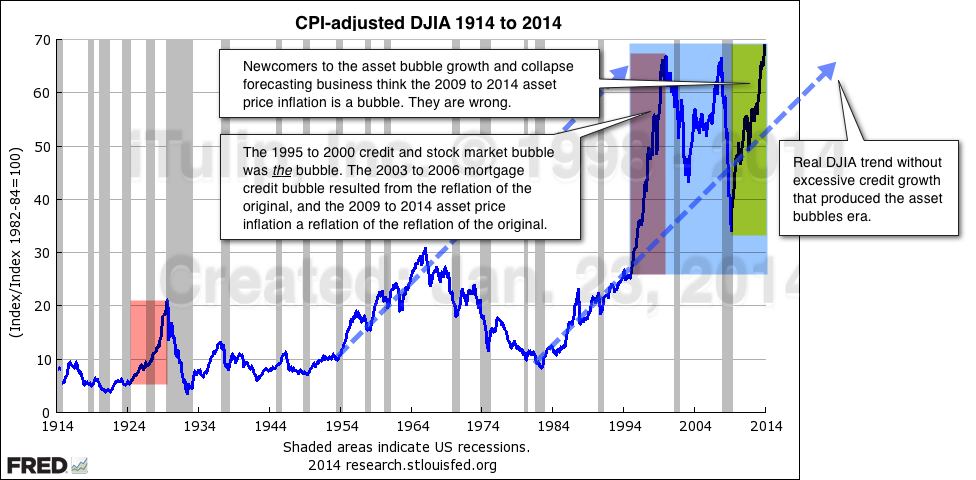
The original 1995 to 2000 asset bubble has now been reflated twice.
CI: Call it a re-re-bubble?
EJ: The attention today is on the second reflation of the original asset bubble shown in red in the chart above. That second reflation shown in yellow/green is topping out now, but the important feature to note in the chart is the the area in blue. The series of market extremes within that area was produced by the distortion of the credit structure produced by a set of interacting processes related to the operating of the global monetary system. Remember, the Fed expanded its balance sheet from 5% to 24% of GDP, and deficit spending reached 10% of GDP in 2009, and the Chinese lent us $1 trillion to make this happen. If there is a "next time" after this latest reflation fails, then what does that mean for the Fed's and U.S. government's balance sheets? The Fed's balance sheet isn't really infinite, despite what Greenspan used to assert. Can it be expanded to $10 trillion or $20 trillion to hold corporate bonds and junk bonds and all of the other debt that grew out of the Fed's yield curve manipulations?
CI: Okay, I'm properly terrified.
EJ: Both the speed and extent of the Fed's response is key, and that depends on their fully understanding the danger, as Bernanke did before that last crisis, and have an actionable plan as Bernanke did and in fact published in a famous November 2002 Deflation: Making Sire "It" Doesn't Happen Here speech. I go deeper into this in Part II but this is key: inflation is dangerously low today versus 2000 or 2007 at previous market peaks. The conditions are far more similar to 1929 when inflation was already very low before the market crashed.
CI: You've met Yellen. Do you thing she understands this?
EJ: I met her very briefly, not long enough by any stretch of the imagination to inform an opinion of how she'll respond to a second AFC and mid-gap recession. I seriously doubt she'll do a Roy Young.
CI: What's a Roy Young?
EJ: It's a Fed chairman move that causes the banking and credit markets to collapse, followed by a failure to meet the exploding demand for money that occurs in a debt deflation.
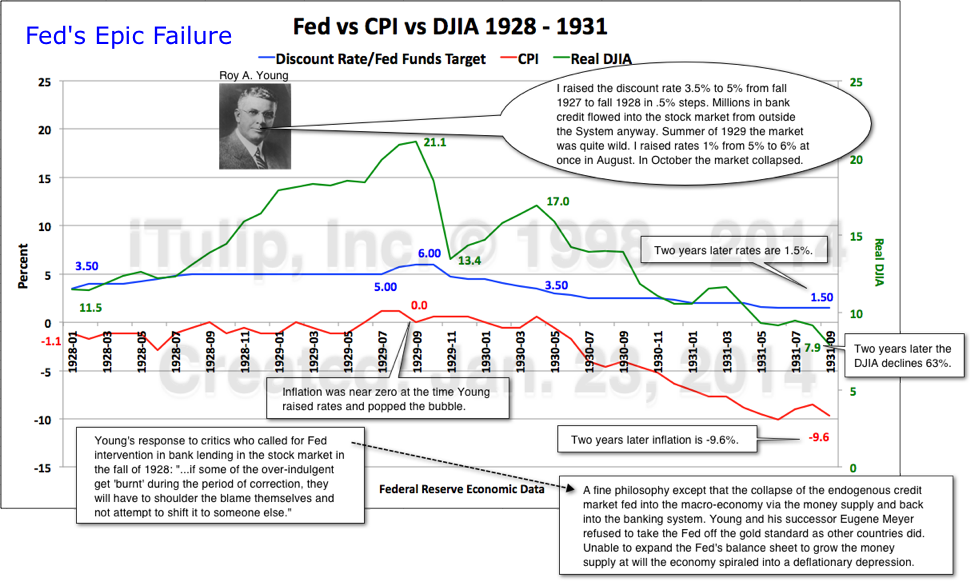
The Fed has popped every bubble, starting with the 1920s stock market bubble. A 1% rate hike from 5% to 6% by
the Fed when Roy Young was chairman did the trick.
The moral of the 1920s is this: A central bank that fails to nip an asset bubble in the bud in times of low inflation is asking for trouble. When the bubble gets out of control, measures taken to finally bring it down can also bring down the credit structure and economy. Everyone forgets that it was the Fed that popped both the housing bubble and the stock market bubble. Both times inflation was well over 3% and rising, and the Fed Funds rate over 5.5% at market peaks. Now the Fed Funds rate is virtually zero and the CPI has trended down from 3.9% in 2011 to 1.5% in Dec. 2013. For the first time since we started in 1998 the deflationist camp is in a strong starting position.
CI: What can the Fed do?
EJ: The Fed can always expand its balance sheet even further, and I think that will be part of the strategy, but the Federal government will have to open its wallet again, too. The Fed is already holding claims on the U.S. economy amounting to nearly 25% of GDP as a consequence of doing so much of the heavy lifting to halt debt deflation after the AFC.
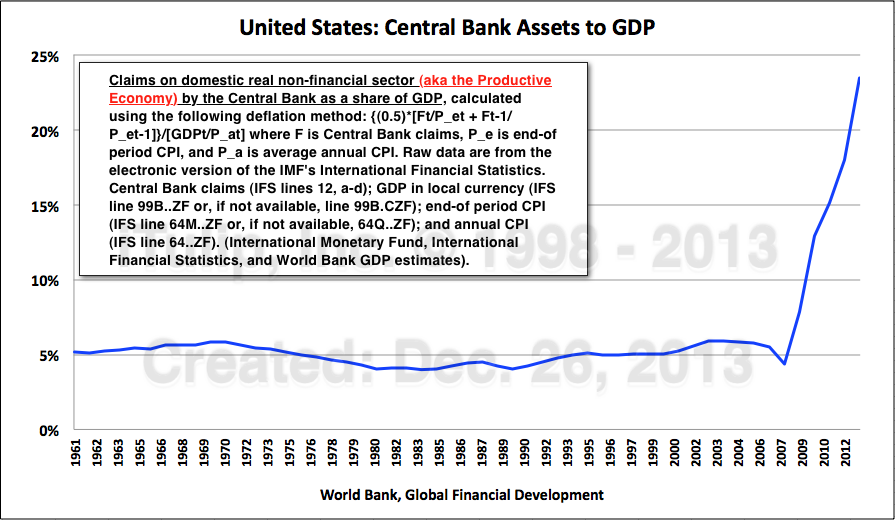
How much more can the Fed's balance sheet hold? 100% of GDP? More?
CI: Are you a deflationist now?
EJ: I've been pointing out for years that these policies, starting with the NASDAQ bubble when I was writing about that in the late 199s, are taking us down a dangerous road. The fact is the economy has not recovered from the last recession and if the markets crash now we are almost certain to have the mid-gap recession that I forecast last year for this year. Ultimately the debt deflates and my worry has always been, as spelled out in the Janszen Scenario since 1998, that the debt will ultimately be deflated against the exchange rate value of the US dollar and that will be anything but deflationary.
CI: A mid-gap recession is a recession that happens before the output gap created by the previous recession closes, right?
EJ: Correct. The Congressional Budget Office broke the Real Potential GDP data series that we've been using here for years and this required us to formulate our own. It clearly shows that the output gap from the past recession remains open. This explains the low inflation environment.
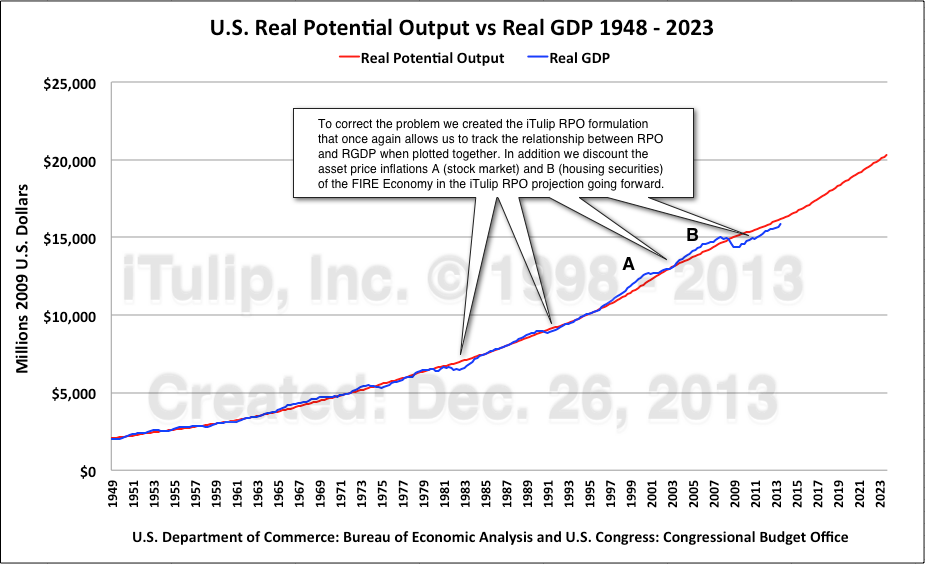
Real GDP vs iTulip Real Potential Output (iRPO) identifies bubble-related output surpluses A and B.
First policy makers enabled the housing bubble to re-create the conditions of high employment
and low inflation of the NASDAQ bubble before it. When that failed the Fed used QE to try to get
the economy back on the historical potential output growth trend but has failed.
CI: QE didn't work?
EJ: It did exactly what it was supposed to do but I think the financial media have done a poor job of explaining how QE works.
CI: Can you summarize?
EJ: Sure. The theory behind QE is that if the central bank can inflate financial asset prices on household balance sheets then households will go out and spend between 5% and 15% of capital gains on current consumption, the so-called wealth effect. The two assets that make up approximately 80% of household balance sheets are equities and home values, the other smaller contributors being such assets as pension funds, cash deposits, and so on, totaling up to the other 20% or so. Clearly the big bang for the asset inflation buck is inflating equity prices and home values. QE has increased personal consumption by approximately $200 billion per year since 2008.
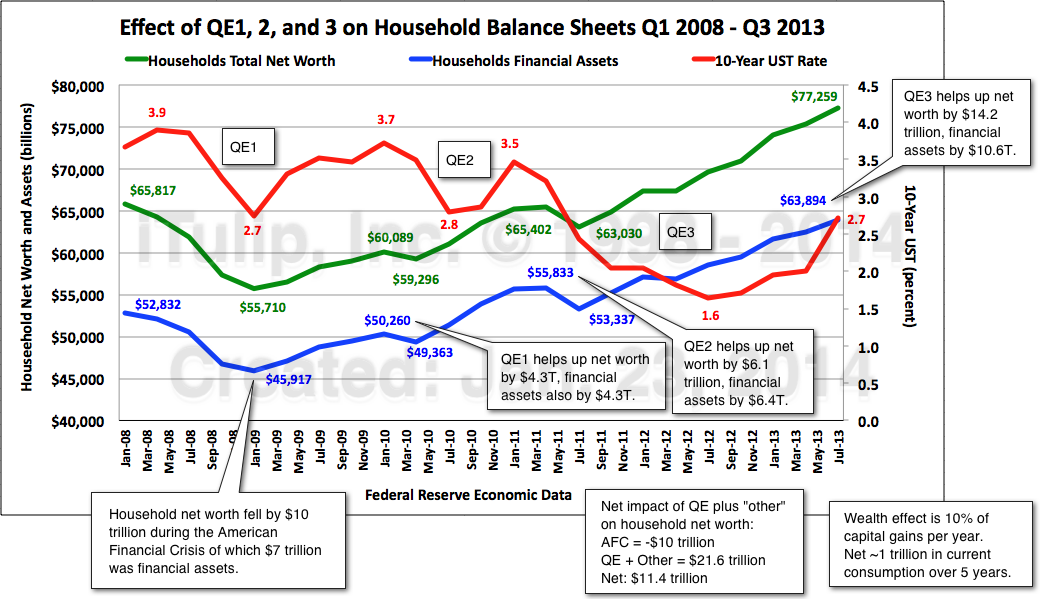
QE inflated household balance sheets by approximately $11 trillion over five years. This translates into
approximately $1 trillion in incremental personal consumption expenditures or $200 billion per year.
CI: If the market crashes won't household balance sheets shrink again and won't the benefits of the Fed's asset price inflation be lost?
EJ: Yes the wealth effect works both ways, positive and negative. If financial assets take a hit then so will consumption. In any case, if you read the Fed papers on QE it isn't a long-term solution to boosting demand. It wears off pretty quickly. The long-term solution is rising incomes not capital gains, and that means jobs. You can't run a consumer economy on capital gains, you need incomes.
As you can see that in the chart above, there is a lag between the start of each QE program, a decline in interest rates, and a rise in financial assets on household balance sheet, then a correction in assets, then the next QE. The last QE sent rates down from 3.6% to 1.2% added $10 trillion to the value of financial assets. If that reverses quickly before unemployment declines to, say, 5% then the economy is in a world of hurt. So the Fed has created a bizzaro world where the stock market is at all-time real highs due to its own asset reflation policy and it's forced to back off even though the labor market isn't strong enough yet to provide the incomes to substitute for capital gains to drive consumption. By withdrawing QE now the Fed is in effect causing a correction in the asset inflation that it created for the purpose of closing the output gap with capital gains as a substitute for employment income. In a way Yellen by continuing with Bernanke's taper policy is doing a Roy Young.
CI: What about all of the households that got out of stocks and are sitting on piles of cash? There are well positioned for a major correction, right?
EJ: Much has been said about retail investors staying out of the stock market after the AFC and it's partly true.
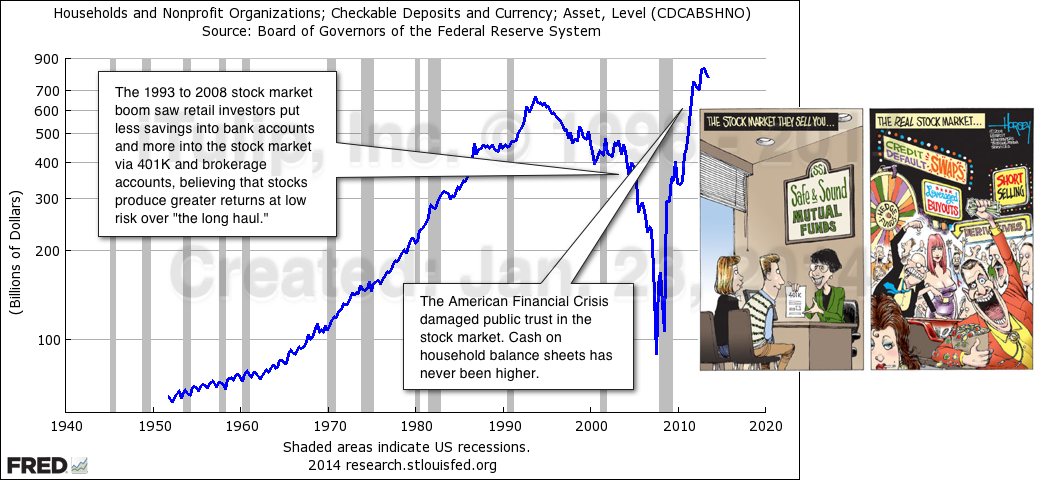
Households are sitting on $800 billion in cash versus $100 billion before the AFC.
Still, cash is less that $1 trillion of the $64 trillion in total financial assets or 1/64th of the total. Corporate equities make up $25 trillion.
CI: How does the Fed's asset purchases of bonds inflate stock prices? They aren't buying equities.
EJ: The inflation doesn't come about directly though equity purchases but through the bond market. The way that artificially low yields inflate equity prices is complex and we'll talk more about it in Part II, but one channel is the flood of cheap credit into the corporate bond market.
Low interest rates compelled firms to borrow $407 billion per year since 2009 vs $133 billion per year in the previous recovery. Firms used the cash for acquisitions, stock buy-backs, and are hoarding more than ever.
Corporate balance sheets may have a lot of cash on them but offsetting this is a record level of debt.
CI: Problem?
EJ: It's entirely logical for corporations to take advantage of low yields but the fact is that the corporate sector is now heavily leveraged and if the economy rolls over debt repayment competes with other uses for working capital, like capital investment and payroll. It could exacerbate the next recession.
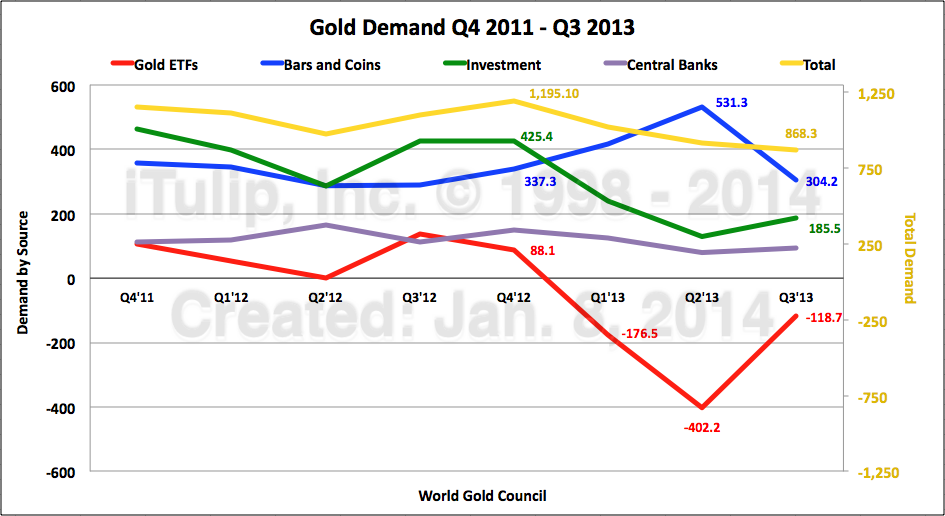
CI: We'll get your conclusions on the stock market and economy in Part II. I have to ask about gold. The "stocks and houses" business media had a field day in 2013. Best gold doomer article was Gold: Turns a wealth destroyer, bites dust. What happened in 2013? What's in store for 2014?
EJ: My June 2013 article explains the the valuation of gold as governed by Good as Gold for Oil or GAGFO pricing. I figured if the trends that began in 2011 that improved the GAGFO value of the USD continued in 2013 then the gold price was going to keep falling. The chart below is from the article, per the watermark created May 22, 2013.
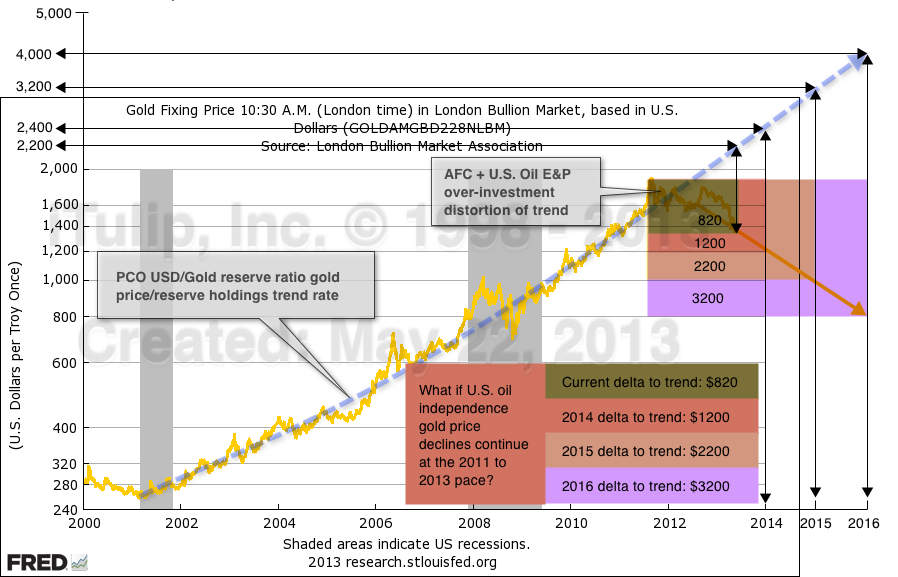
CI: If I'm reading the May 22, 2013 chart above right it says gold at $1200 by the end of 2013?
EJ: Yes, if the trends I hypothesized as the cause of the gold price decline since 2011 continued, which they did, then the model indicates a gold price of $1200.
CI: The gold spot price on Dec. 30, 2013 was $1,205.50.
EJ: Close enough.
CI: What's in store for 2014?
EJ: Wait, let's unpack exactly what happened from 2011 to the end of 2013 to bring gold down from the 1800s to the 1200s. Two developments have improved the GAGFO value of the USD, the budget deficit and trade deficit. Since 2011 the rate of increase in government outlays has declined as GDP grew versus both growing together as typically happens, including a 1% of GDP cut in defense spending. More significantly for gold there's been a radical reduction in the oil trade deficit. Of these two factors the oil trade deficit contributed by far the most to the decline in the gold price in 2011 and 2012. As oil imports declined, the accumulation of excess USD reserves by oil producing countries, which UST reserves they hedge with gold, also declined. Then in 2013 funds dumped their gold ETFs. They did this in order to not look stupid for holding gold instead of more equities for another year as stock prices went up and gold went nowhere. It was this selling of gold via ETFs that sent gold prices down in 2013.
CI: Is gold coming back to life in 2014?
EJ: Oil trade deficit improvement or not, other factors of the GAGFO value of the USD matter, specifically the budget deficit and the Fed's balance sheet, both of which are claims on the real economy. Somewhere, no one knows exactly where, there is a threshold which when passed causes foreign holders of UST to assess that repayment of the current debt plus the additional debt need to reflate the economy is, over the average duration of all of the bonds, mathematically impossible. If that threshold is surpassed in this next crisis then the markets as we see them today are indeed the Last Bubble. If we have another market crisis like we had in 2008 or worse, those of us with exposure to the equity markets will be glad we have gold to hedge the risk of a fresh crisis.
2013 Review and 2014 Forecast - Part II: Global Manic Depression

manic depression (noun): the condition of an economy stuck in an
output gap that was created by a recession that was produced by
the collapse of an asset bubble, which output gap the central bank is
attempting to close by stimulating the economy with a new asset bubble.
� US macro good news, bad news -- mostly the latter
� Fed fails to fill the output gap with asset price inflation
� The Fed broke my yield curve (recession indicator)
� We don't need your stinking oil
� GAGFO or bust
� Stock market peak and here we go again
In 2007 I debated respected deflationists like Steve Keen who agreed with me that a credit crisis and recession were imminent. However, he and they were convinced that a price deflation and debt default spiral was to follow. It was my view that the Fed was going to throw everything and the kitchen sink at the credit markets and halt the deflation process.
That was then.
Back then I could point to the Fed's plans going back to 2003 to prevent a repeat of The Great Depression. In 2008 as in the early 1930s the faulty credit structure of the American financial system was vulnerable to crisis and the Fed knew it, thus the extensive planning. Both credit crises happened for similar reasons: unregulated investment banks made a preposterous number of bad loans in the money markets, in the 1930s in the stock market and in the 2000s in the housing market. In the 1930s instance the extreme demand for money in debt deflation quickly overwhelmed the liquidity provisions of the System, then limited by the statutory restrictions of the gold standard. In 2008 and 2009, sans the golden handcuffs the Fed was able to expand its balance sheet by trillions of dollars to reflate at will.
The deflation debate in 2007 was far ahead of the mainstream economics "conversation." The context of the inflation versus deflation debate was a credit crisis and deep recession that at the time few believed was likely but that we assumed was inevitable. The inevitability of a credit crisis was doubted by the mainstream business and economics community well into 2008 when my Harper's article "The Next Bubble" was published. Also, the idea that monetary policy had made the U.S. economy asset price inflation dependent was viewed at the time as controversial.
Since then much has changed. The predicted credit crisis occurred and the Fed used most if not all of the policy measures described in its playbook to prevent a run-away debt deflation spiral. In 2013 Bernanke at press conferences defended QE as an effective tool of economic policy because it "inflated asset prices." The solution to the credit crisis was the same: more credit. But more credit means more debt, and more debt means a bigger crisis later.
Through the past two asset price booms, busts, and reflations since the late 1990s the Fed has trained the markets to wait for the next crash as a buying opportunity for the inevitable reflation. Market consciousness today is infused with a manic depressive, bi-polar rationalization of the irrational conditions of the credit system.
The 1998 Janszen Scenario theorizes that at the end of this asset price inflation, deflation, reflation cycle lurks a final deep deflationary process to cap the asset price inflation era, to which monetary authorities and legislatures respond again with a final credit expansion. But, that rather than expanding the purchasing power of bonds it causes a loss of faith in the monetary units in which the bonds are denominated. A global US dollar, euro, and yen bond and currency crisis follows.
With the advent of QE I theorized that the trigger for this final act of the play that started its run in 1995 is the Fed itself. QE distorts the very foundation of the global credit structure, US Treasury bond, which foundation replaced gold in the early 1970s. With QE the Fed has achieved the impossible under the gold standard. It has taken away the last reliable measure of credit risk from the markets and put it into the hands of technocrats.
Adjusting interest rates on the short end of the yield curve via open market operations has long been accepted as the Fed's primarily policy tool for meeting its mandate to maintain a stable price level in the economy. Generally short in duration, adjustments to the Fed Funds Target Rate in either direction up or down lasting six months to two years at most, these interventions in the money markets are known to the markets as temporary. But QE by the world's reserve currency issuer has been going on since late 2008, for more than five years. That is not an intervention. It is price fixing, pure and simple. It is the Fed using its balance sheet against the collective balance sheet of market participants to set the price of the bonds that form the base of the credit structure the way gold used to, except that no one country could control the price of gold. No single country issued gold.
Here's the thing. After five years of long bond price fixing, how can market participants know the market price of a 10-year UST?
The Fed Funds Target Rate is an afternoon sea fishing excursion a mile from the dock, the shore in clear view and the passengers on the boat able to judge the distance from the shore and the time to return to it (yield to maturity). QE is a week spent floating in the ocean in dense fog. All around the passengers as far as they can see is grey, then dark, then grey again. Then the Fed decides to turn the ship toward shore (taper). As the shore comes into view, passengers are finally able to judge their distance from shore. The reality of their position will invariably come as a shock, as either too close or too far, for a week of orientation -- a continuum of price signals -- has been lost.
The rational response for the passengers of the ship to the epiphanous bond price discovery? Panic.
The slowing of the Fed's bond price fixing operations in the fall of 2013 has so far sent two bodies overboard: the U.S. Muni market and emerging market bonds.
Here I make the argument that, philosophically, the Fed's decision to reduce asset purchases is equivalent in form and degree of misjudgment to the error made by Fed chairman Roy Young in the 1920s to tighten monetary policy at a time of an asset price peak and low inflation, when the underlying credit structure was fragile, to put it politely, perverse to put it bluntly.
In a careful study of the six economic eras of the last century I show that incoming Fed chair Janet Yellen Fed faces a unique set of challenges. The next crisis will be far more difficult to manage than the last, and there is neither evidence of a plan nor evidence of awareness that a plan is needed. The apparent obliviousness of the risks presented to the global economy by Bernanke's post-American Financial Crisis policies lends a sense of unreality to the economic scene in 2014. more...
iTulip Select: The Investment Thesis for the Next Cycle�
__________________________________________________
To receive the iTulip Newsletter or iTulip Alerts, Join our FREE Email Mailing List
Copyright � iTulip, Inc. 1998 - 2014 All Rights Reserved
All information provided "as is" for informational purposes only, not intended for trading purposes or advice. Nothing appearing on this website should be considered a recommendation to buy or to sell any security or related financial instrument. iTulip, Inc. is not liable for any informational errors, incompleteness, or delays, or for any actions taken in reliance on information contained herein. Full Disclaimer
Photo Credit: Glenn Cantor
� Stock market crash, right on schedule. Time to Short?
� Is the Yellen Fed doing a Roy Young?
� China's Great Wall of Money crumbles. Who will be America's IMF this time?
� Why do they call them Emerging Markets? Because it's hard to get your money out in an Emergency.
� Gold says, "I'm not dead yet!"
What? You thought it could go on forever? The asset bubbles and re-bubbles and re-re-bubbles?
How many times can your reflate a torn up rubber raft?
Time to chuck it out and get a new one.
Except that there isn't a new one. This is it. The only one we got and we're all in it together.
And, gosh, looking back on it, over the past 20 years, maybe we shouldn't have taken it through Class V rapids twice loaded with beer kegs.
But here we are, cheek to cowl, in this giant, flaccid, half inflated economy, damage from the last two runs shoddily patched, headed over the rapids again. Without so much as a roll of duct tape.
While the usual bearish crowd was busy capitulating over the past six months and calling for continued growth and a good year for the markets in 2014, maybe not as booming great as 2013, I've been following the data and it takes me to a different place, to an epic and virtually unstoppable calamity.
Not that I didn't try to build an optimistic case to counter my June 2013 forecast The Post-Market Economy � Part II: The Crash of 2014, it's just that the data kept dragging me off that run.
The ineludible obstacle in the path of any hopeful line of argument is the fact that the current recovery from the 2008 credit crisis that followed from the condition of over-indebtedness and risk-polluted credit markets has since 2009 been achieved by means of credit inflation which has produced even greater over-indebtedness.
Credit risk pollution, rather than pooled in an obscure corner of the credit markets and seeping into the global financial system by way of pension funds, this time around has been injected into the foundation of the endogenous credit structure by means of the Fed's "yield curve shaping," a polite term used by academics in place of the rude but more truthful term "long-bond price fixing."
I don't blame anyone for wanting to turn and look the other way. God knows we've been through enough, especially those citizens of the world who have not benefited from the regressive reflation policies of central banks. These have primarily benefitted the asset holding classes. A recent Gallup poll reveals 58% of Americans think the economy is getting worse, and I doubt they are in any mood to hear bad news about the future. Economic doomertainment is out of fashion, and that fact alone tells you that popular sentiment is still dower. In hard times, American Idol-type hopertainment makes a comeback.
It's not all bad news. Fortress America economic and policies are working their magic on the trade deficit, and are creating a beneficent spread between U.S. and world oil prices that is providing a big assist to the recovery. But to spy objects of economic beauty you have to crane your neck to see over the ugly fact that as recently as the year 2000 only $2.4 of new debt creation was needed to produce $1 of GDP growth and today that ratio is $4.6 to $1. Credit-financed growth is fun while it lasts, but historically has proved most miserable in reverse gear.
If you have a strong stomach and a firm grip, grab your helmet and jump in for a guided tour of the Last Bubble. But don't close your eyes. You can't read that way.
CI: Let's get right to it: the stock market. What happened in 2013 and what's in store for 2014? You noted the tops of the last two bubbles precisely, the first in March 2000 and the second November 2007. May 2011 you said the stock market was set to top-out at the end of 2013 then crash. Is it "Time to short" again?
EJ: The "time to short" calls in March 2000 and November 2007 were a luxury of knowing three things: 1) the process that was producing the asset bubble, 2) the events that were likely to end them, and 3) the monetary and fiscal policy response to the liquidity crisis, negative wealth effects, and recessions they produced. The difficulty with this particular asset price inflation -- I won't call it a "speculative bubble" because it isn't -- is that it was manufactured explicitly to produce positive wealth effects. It's the result of the Fed's large-scale long-bond price fixing operation known as QE.
That makes this asset price inflation fundamentally different than the previous two. The stock market has been about QE since late 2008 and is still about QE and, or of course, about Janet Yellen. The Bernanke Fed's policy of spurring aggregate demand with positive wealth effects using QE succeeded to a far greater extent than he's been given credit for. But it's a short-term fix, intended to "prime the pump" until the "engine of the economy" catches, or so goes the Keynesian model for counter-cyclical monetary policy. Philosophically it is in the traditional of the Keynesian reflation prescription of deficit spending, and it should be noted that whether the treasury bonds are on the Fed's or the Federal Government's balance sheet they are still claims on the real economy. In reality it's all fiscal stimulus. Whether the liability to the economy is on central bank or central government account will be a precious distinction when the cows come home.
CI: So... "Time to short?"
EJ: With respect timing of a correction, this second instantiation of the original asset bubble is as predictable as the previous two. The difficulty is that the nature of this asset price inflation is unlike the other two and without precedent. The trigger for the crash of this last and perhaps final asset inflation since 1995, well, I've been talking about that here for years. It ends with the Fed's misguided and arrogant bond price fixing operation and with the transition of the Fed chair position to Yellen. The question is do we get a more or less continuous mean regression to the sans-asset-inflation level as in 2000 and again in 2008 or something else.
CI: In 1999 your forecast for the NASDAQ crash was 80%, with no recovery to tear 2000 peak for ten years or more. In 2007 you said the S&P500 destined to correct 40% in 2008. This time?
EJ: The difficulty in forecasting the extent is lack of precedent. The market correction in 2008 resulted from the stock market pricing in the recession that the mortgage credit bubble collapse and American Financial Crisis (AFC) was causing. The 2008 correction process was roughly analogous to the Nikkei crash in 1990 that priced in the recession caused by the collapse of Japan's 1980s property bubble. My estimate of a 40% decline in the DJIA in 2008 was guided by that, and other inputs. But this asset inflation is without precedent, and the pre-conditions, too, are unique, so I think an estimate of the extent of decline is educated guesswork. My estimate in 2011 was for the early 2014 DJIA correction on the order of 60%, and I'll stick with that.
CI: Let's review that 2011 Real DJIA forecast.
EJ: In May of 2011 I saw the stock market coming out of the AFC in a second reflation of the original 1995 to 2000 asset bubble that motivated me to start iTulip in 1998. My forecast for the Real DJIA looked like this mid-2011. Basically I expected QE-fueled asset price inflation to carry the market up until the end of 2013.
Forecast is for the inflation-adjusted Real DJIA to rise to slightly over 100 until the end of 2013.
A Dec. 30, 2013 update to the April 2011 chart, below.
The Real DJIA reached just over 100 before starting to correct in Jan. 2014.
CI: This may be more than a correction, then? I mean, really? A 56% decline?
EJ: In mid-2011 I projected what I called the Extended Asset Price Inflation Case. That's the green line. The Real DJIA was to climb from 83 at the time to just over 100 by the end of 2013. Early in 2014 it begins to price-in a mid-gap recession later in the year. The first chart was published April 2011 as the watermark indicates. The update was generated from the same excel file. The DJIA data are from the Dow Jones & Co. and the inflation adjustments updated using the latest data from the Real DJIA web site that we've been using since 2006.
CI: So the crash you forecast in mid-2011 for early 2014 is happening? Wish you'd reminded me of this chart sooner!
EJ: That would appear to be the case. However, a crash of the full extent of 56% shown spells complete disaster for the U.S. economy. I seriously doubt that the Yellen Fed will stand by, or at least I hope they understand the danger. The correction is a delayed reaction to the beginning of the end of the Fed's bond price fixing operation, which ending I have warned for years was to produce chaos in the bond market as market participants thrashed around trying to figure out what the market price of a long bond is without the Fed's interference in the market. By the way, a member asked me about this in December in the Ask EJ section here, which is why the update has a Dec. 30, 2013 watermark on it.
CI: So why not short it? If you got the timing right.
EJ: I've found over the past 15 years that it pays to wait for the second break after the initial correction in a crash process, if that indeed what this is. There are cross-currents, such as capital flight from emerging markets into the U.S., possibly stronger than expected GDP and employment numbers for Q4 2013. That's why I'm reluctant to short it just yet. But I think it's a mistake to think that the declines in the indexes as normal market fretting over a transition to tighter monetary policy as the economy picks up. In Part II we take a closer look at additional indicators, such as VIX.
CI: Have you tried to build the case for that, for the market to correct, the "healthy correction" that everyone has been hoping for, followed by more gains as the economy picks up?
EJ: Yes but it's just not credible. The markets are far more precarious now than at any time since I started iTulip in 1998. At time of the peaks of the two speculative bubbles in 2000 and 2007, the over-priced assets at risk were confined to narrow classes of assets, the macro-economy was less fragile, inflation was higher, and so on, as I cover in the next part. Additionally the Fed has already used up interest rate policy as a anti-deflation policy tool. The Fed is now limited Zero Interest Rate Policy (ZIRP) options, namely, loading securities onto its balance sheet.
What if the Fed reverses taper and re-starts asset-price inflation? Only if the markets are convinced
that the Fed and Congress can via fresh stimulus can prevent the economy from falling back into recession.
Traded Value percent GDP usually rises and fall with the market. This time firms used low yields to
issue debt and use the cash to buy back stock and propel prices upward, no trading involved.
CI: In 1998 and in 2006 "bubble or not" was hot topic of debate. Today seems like everyone thinks the markets are a bubble. Robert Shiller last week said he thought the stock market was a bubble but also said he was buying stocks anyway.
EJ: Which doesn't make much sense. Maybe he thinks it's reached a permanently high plateau. After working this problem since 1996 when I started to do research for iTulip before I launched it in 1998, my frame of reference is the sweep of the past 16 years. I don't see the markets today as a bubble but as a last-ditch, maybe final, effort to get the economy back to the inflated level it got to in 2000 as a result of an extraordinary infusion of credit into the economy around 1994.
The original 1995 to 2000 asset bubble has now been reflated twice.
CI: Call it a re-re-bubble?
EJ: The attention today is on the second reflation of the original asset bubble shown in red in the chart above. That second reflation shown in yellow/green is topping out now, but the important feature to note in the chart is the the area in blue. The series of market extremes within that area was produced by the distortion of the credit structure produced by a set of interacting processes related to the operating of the global monetary system. Remember, the Fed expanded its balance sheet from 5% to 24% of GDP, and deficit spending reached 10% of GDP in 2009, and the Chinese lent us $1 trillion to make this happen. If there is a "next time" after this latest reflation fails, then what does that mean for the Fed's and U.S. government's balance sheets? The Fed's balance sheet isn't really infinite, despite what Greenspan used to assert. Can it be expanded to $10 trillion or $20 trillion to hold corporate bonds and junk bonds and all of the other debt that grew out of the Fed's yield curve manipulations?
CI: Okay, I'm properly terrified.
EJ: Both the speed and extent of the Fed's response is key, and that depends on their fully understanding the danger, as Bernanke did before that last crisis, and have an actionable plan as Bernanke did and in fact published in a famous November 2002 Deflation: Making Sire "It" Doesn't Happen Here speech. I go deeper into this in Part II but this is key: inflation is dangerously low today versus 2000 or 2007 at previous market peaks. The conditions are far more similar to 1929 when inflation was already very low before the market crashed.
CI: You've met Yellen. Do you thing she understands this?
EJ: I met her very briefly, not long enough by any stretch of the imagination to inform an opinion of how she'll respond to a second AFC and mid-gap recession. I seriously doubt she'll do a Roy Young.
CI: What's a Roy Young?
EJ: It's a Fed chairman move that causes the banking and credit markets to collapse, followed by a failure to meet the exploding demand for money that occurs in a debt deflation.
The Fed has popped every bubble, starting with the 1920s stock market bubble. A 1% rate hike from 5% to 6% by
the Fed when Roy Young was chairman did the trick.
The moral of the 1920s is this: A central bank that fails to nip an asset bubble in the bud in times of low inflation is asking for trouble. When the bubble gets out of control, measures taken to finally bring it down can also bring down the credit structure and economy. Everyone forgets that it was the Fed that popped both the housing bubble and the stock market bubble. Both times inflation was well over 3% and rising, and the Fed Funds rate over 5.5% at market peaks. Now the Fed Funds rate is virtually zero and the CPI has trended down from 3.9% in 2011 to 1.5% in Dec. 2013. For the first time since we started in 1998 the deflationist camp is in a strong starting position.
CI: What can the Fed do?
EJ: The Fed can always expand its balance sheet even further, and I think that will be part of the strategy, but the Federal government will have to open its wallet again, too. The Fed is already holding claims on the U.S. economy amounting to nearly 25% of GDP as a consequence of doing so much of the heavy lifting to halt debt deflation after the AFC.
How much more can the Fed's balance sheet hold? 100% of GDP? More?
CI: Are you a deflationist now?
EJ: I've been pointing out for years that these policies, starting with the NASDAQ bubble when I was writing about that in the late 199s, are taking us down a dangerous road. The fact is the economy has not recovered from the last recession and if the markets crash now we are almost certain to have the mid-gap recession that I forecast last year for this year. Ultimately the debt deflates and my worry has always been, as spelled out in the Janszen Scenario since 1998, that the debt will ultimately be deflated against the exchange rate value of the US dollar and that will be anything but deflationary.
CI: A mid-gap recession is a recession that happens before the output gap created by the previous recession closes, right?
EJ: Correct. The Congressional Budget Office broke the Real Potential GDP data series that we've been using here for years and this required us to formulate our own. It clearly shows that the output gap from the past recession remains open. This explains the low inflation environment.
Real GDP vs iTulip Real Potential Output (iRPO) identifies bubble-related output surpluses A and B.
First policy makers enabled the housing bubble to re-create the conditions of high employment
and low inflation of the NASDAQ bubble before it. When that failed the Fed used QE to try to get
the economy back on the historical potential output growth trend but has failed.
CI: QE didn't work?
EJ: It did exactly what it was supposed to do but I think the financial media have done a poor job of explaining how QE works.
CI: Can you summarize?
EJ: Sure. The theory behind QE is that if the central bank can inflate financial asset prices on household balance sheets then households will go out and spend between 5% and 15% of capital gains on current consumption, the so-called wealth effect. The two assets that make up approximately 80% of household balance sheets are equities and home values, the other smaller contributors being such assets as pension funds, cash deposits, and so on, totaling up to the other 20% or so. Clearly the big bang for the asset inflation buck is inflating equity prices and home values. QE has increased personal consumption by approximately $200 billion per year since 2008.
QE inflated household balance sheets by approximately $11 trillion over five years. This translates into
approximately $1 trillion in incremental personal consumption expenditures or $200 billion per year.
CI: If the market crashes won't household balance sheets shrink again and won't the benefits of the Fed's asset price inflation be lost?
EJ: Yes the wealth effect works both ways, positive and negative. If financial assets take a hit then so will consumption. In any case, if you read the Fed papers on QE it isn't a long-term solution to boosting demand. It wears off pretty quickly. The long-term solution is rising incomes not capital gains, and that means jobs. You can't run a consumer economy on capital gains, you need incomes.
As you can see that in the chart above, there is a lag between the start of each QE program, a decline in interest rates, and a rise in financial assets on household balance sheet, then a correction in assets, then the next QE. The last QE sent rates down from 3.6% to 1.2% added $10 trillion to the value of financial assets. If that reverses quickly before unemployment declines to, say, 5% then the economy is in a world of hurt. So the Fed has created a bizzaro world where the stock market is at all-time real highs due to its own asset reflation policy and it's forced to back off even though the labor market isn't strong enough yet to provide the incomes to substitute for capital gains to drive consumption. By withdrawing QE now the Fed is in effect causing a correction in the asset inflation that it created for the purpose of closing the output gap with capital gains as a substitute for employment income. In a way Yellen by continuing with Bernanke's taper policy is doing a Roy Young.
CI: What about all of the households that got out of stocks and are sitting on piles of cash? There are well positioned for a major correction, right?
EJ: Much has been said about retail investors staying out of the stock market after the AFC and it's partly true.
Households are sitting on $800 billion in cash versus $100 billion before the AFC.
Still, cash is less that $1 trillion of the $64 trillion in total financial assets or 1/64th of the total. Corporate equities make up $25 trillion.
CI: How does the Fed's asset purchases of bonds inflate stock prices? They aren't buying equities.
EJ: The inflation doesn't come about directly though equity purchases but through the bond market. The way that artificially low yields inflate equity prices is complex and we'll talk more about it in Part II, but one channel is the flood of cheap credit into the corporate bond market.
Low interest rates compelled firms to borrow $407 billion per year since 2009 vs $133 billion per year in the previous recovery. Firms used the cash for acquisitions, stock buy-backs, and are hoarding more than ever.
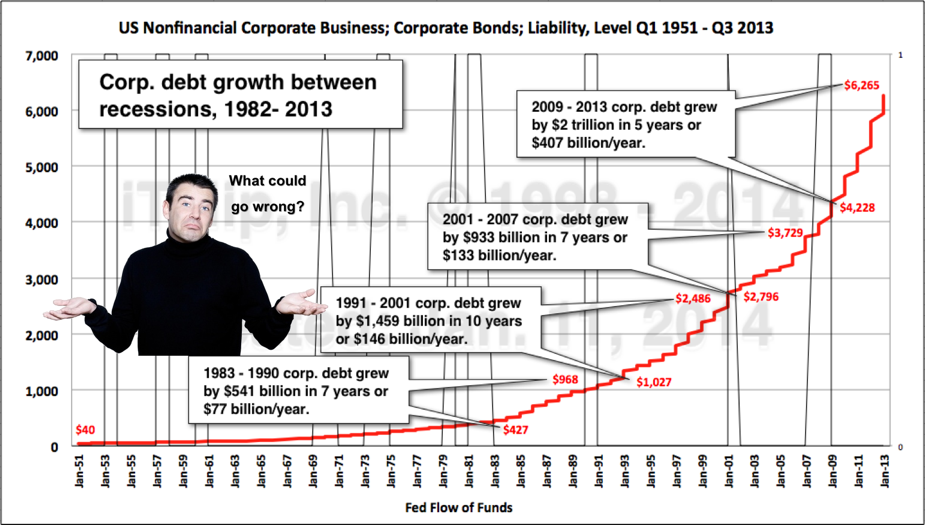
CI: You've pointed out in the past that the Next Bubble can be identified as that asset which kept on rising right through the last asset-bubble era recession. What asset was that this time?
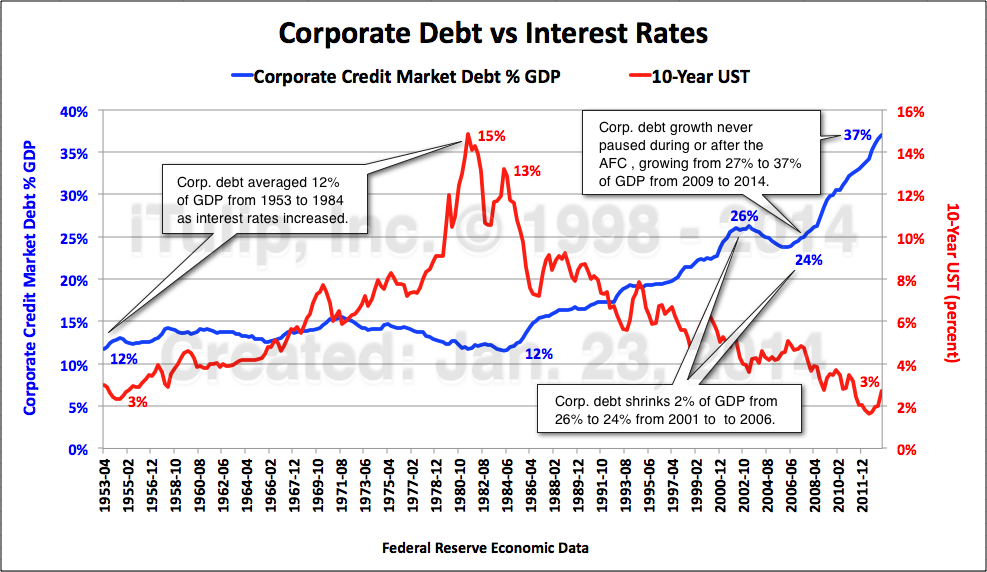
EJ: Again, I prefer to call this an asset bubble because it lacks the speculative fervor of a speculative bubble, but if you're looking for an asset that never took a breather even through the AFC it's corporate debt. From 2007 before the crisis to today corporate debt liabilities grew from 24% to 37% of GDP. Before that, during the era of falling interest rates since 1983 that created the FIRE Economy and for 24 years until 2007 corporate debt to GDP doubled from 12% to 24% of GDP. Then it grew 36% in six years.
EJ: Again, I prefer to call this an asset bubble because it lacks the speculative fervor of a speculative bubble, but if you're looking for an asset that never took a breather even through the AFC it's corporate debt. From 2007 before the crisis to today corporate debt liabilities grew from 24% to 37% of GDP. Before that, during the era of falling interest rates since 1983 that created the FIRE Economy and for 24 years until 2007 corporate debt to GDP doubled from 12% to 24% of GDP. Then it grew 36% in six years.
Corporate balance sheets may have a lot of cash on them but offsetting this is a record level of debt.
EJ: It's entirely logical for corporations to take advantage of low yields but the fact is that the corporate sector is now heavily leveraged and if the economy rolls over debt repayment competes with other uses for working capital, like capital investment and payroll. It could exacerbate the next recession.
CI: We'll get your conclusions on the stock market and economy in Part II. I have to ask about gold. The "stocks and houses" business media had a field day in 2013. Best gold doomer article was Gold: Turns a wealth destroyer, bites dust. What happened in 2013? What's in store for 2014?
EJ: My June 2013 article explains the the valuation of gold as governed by Good as Gold for Oil or GAGFO pricing. I figured if the trends that began in 2011 that improved the GAGFO value of the USD continued in 2013 then the gold price was going to keep falling. The chart below is from the article, per the watermark created May 22, 2013.
CI: If I'm reading the May 22, 2013 chart above right it says gold at $1200 by the end of 2013?
EJ: Yes, if the trends I hypothesized as the cause of the gold price decline since 2011 continued, which they did, then the model indicates a gold price of $1200.
CI: The gold spot price on Dec. 30, 2013 was $1,205.50.
EJ: Close enough.
CI: What's in store for 2014?
EJ: Wait, let's unpack exactly what happened from 2011 to the end of 2013 to bring gold down from the 1800s to the 1200s. Two developments have improved the GAGFO value of the USD, the budget deficit and trade deficit. Since 2011 the rate of increase in government outlays has declined as GDP grew versus both growing together as typically happens, including a 1% of GDP cut in defense spending. More significantly for gold there's been a radical reduction in the oil trade deficit. Of these two factors the oil trade deficit contributed by far the most to the decline in the gold price in 2011 and 2012. As oil imports declined, the accumulation of excess USD reserves by oil producing countries, which UST reserves they hedge with gold, also declined. Then in 2013 funds dumped their gold ETFs. They did this in order to not look stupid for holding gold instead of more equities for another year as stock prices went up and gold went nowhere. It was this selling of gold via ETFs that sent gold prices down in 2013.
CI: Is gold coming back to life in 2014?
EJ: Oil trade deficit improvement or not, other factors of the GAGFO value of the USD matter, specifically the budget deficit and the Fed's balance sheet, both of which are claims on the real economy. Somewhere, no one knows exactly where, there is a threshold which when passed causes foreign holders of UST to assess that repayment of the current debt plus the additional debt need to reflate the economy is, over the average duration of all of the bonds, mathematically impossible. If that threshold is surpassed in this next crisis then the markets as we see them today are indeed the Last Bubble. If we have another market crisis like we had in 2008 or worse, those of us with exposure to the equity markets will be glad we have gold to hedge the risk of a fresh crisis.
2013 Review and 2014 Forecast - Part II: Global Manic Depression
manic depression (noun): the condition of an economy stuck in an
output gap that was created by a recession that was produced by
the collapse of an asset bubble, which output gap the central bank is
attempting to close by stimulating the economy with a new asset bubble.
� US macro good news, bad news -- mostly the latter
� Fed fails to fill the output gap with asset price inflation
� The Fed broke my yield curve (recession indicator)
� We don't need your stinking oil
� GAGFO or bust
� Stock market peak and here we go again
In 2007 I debated respected deflationists like Steve Keen who agreed with me that a credit crisis and recession were imminent. However, he and they were convinced that a price deflation and debt default spiral was to follow. It was my view that the Fed was going to throw everything and the kitchen sink at the credit markets and halt the deflation process.
That was then.
Back then I could point to the Fed's plans going back to 2003 to prevent a repeat of The Great Depression. In 2008 as in the early 1930s the faulty credit structure of the American financial system was vulnerable to crisis and the Fed knew it, thus the extensive planning. Both credit crises happened for similar reasons: unregulated investment banks made a preposterous number of bad loans in the money markets, in the 1930s in the stock market and in the 2000s in the housing market. In the 1930s instance the extreme demand for money in debt deflation quickly overwhelmed the liquidity provisions of the System, then limited by the statutory restrictions of the gold standard. In 2008 and 2009, sans the golden handcuffs the Fed was able to expand its balance sheet by trillions of dollars to reflate at will.
The deflation debate in 2007 was far ahead of the mainstream economics "conversation." The context of the inflation versus deflation debate was a credit crisis and deep recession that at the time few believed was likely but that we assumed was inevitable. The inevitability of a credit crisis was doubted by the mainstream business and economics community well into 2008 when my Harper's article "The Next Bubble" was published. Also, the idea that monetary policy had made the U.S. economy asset price inflation dependent was viewed at the time as controversial.
Since then much has changed. The predicted credit crisis occurred and the Fed used most if not all of the policy measures described in its playbook to prevent a run-away debt deflation spiral. In 2013 Bernanke at press conferences defended QE as an effective tool of economic policy because it "inflated asset prices." The solution to the credit crisis was the same: more credit. But more credit means more debt, and more debt means a bigger crisis later.
Through the past two asset price booms, busts, and reflations since the late 1990s the Fed has trained the markets to wait for the next crash as a buying opportunity for the inevitable reflation. Market consciousness today is infused with a manic depressive, bi-polar rationalization of the irrational conditions of the credit system.
The 1998 Janszen Scenario theorizes that at the end of this asset price inflation, deflation, reflation cycle lurks a final deep deflationary process to cap the asset price inflation era, to which monetary authorities and legislatures respond again with a final credit expansion. But, that rather than expanding the purchasing power of bonds it causes a loss of faith in the monetary units in which the bonds are denominated. A global US dollar, euro, and yen bond and currency crisis follows.
With the advent of QE I theorized that the trigger for this final act of the play that started its run in 1995 is the Fed itself. QE distorts the very foundation of the global credit structure, US Treasury bond, which foundation replaced gold in the early 1970s. With QE the Fed has achieved the impossible under the gold standard. It has taken away the last reliable measure of credit risk from the markets and put it into the hands of technocrats.
Adjusting interest rates on the short end of the yield curve via open market operations has long been accepted as the Fed's primarily policy tool for meeting its mandate to maintain a stable price level in the economy. Generally short in duration, adjustments to the Fed Funds Target Rate in either direction up or down lasting six months to two years at most, these interventions in the money markets are known to the markets as temporary. But QE by the world's reserve currency issuer has been going on since late 2008, for more than five years. That is not an intervention. It is price fixing, pure and simple. It is the Fed using its balance sheet against the collective balance sheet of market participants to set the price of the bonds that form the base of the credit structure the way gold used to, except that no one country could control the price of gold. No single country issued gold.
Here's the thing. After five years of long bond price fixing, how can market participants know the market price of a 10-year UST?
The Fed Funds Target Rate is an afternoon sea fishing excursion a mile from the dock, the shore in clear view and the passengers on the boat able to judge the distance from the shore and the time to return to it (yield to maturity). QE is a week spent floating in the ocean in dense fog. All around the passengers as far as they can see is grey, then dark, then grey again. Then the Fed decides to turn the ship toward shore (taper). As the shore comes into view, passengers are finally able to judge their distance from shore. The reality of their position will invariably come as a shock, as either too close or too far, for a week of orientation -- a continuum of price signals -- has been lost.
The rational response for the passengers of the ship to the epiphanous bond price discovery? Panic.
The slowing of the Fed's bond price fixing operations in the fall of 2013 has so far sent two bodies overboard: the U.S. Muni market and emerging market bonds.
Here I make the argument that, philosophically, the Fed's decision to reduce asset purchases is equivalent in form and degree of misjudgment to the error made by Fed chairman Roy Young in the 1920s to tighten monetary policy at a time of an asset price peak and low inflation, when the underlying credit structure was fragile, to put it politely, perverse to put it bluntly.
In a careful study of the six economic eras of the last century I show that incoming Fed chair Janet Yellen Fed faces a unique set of challenges. The next crisis will be far more difficult to manage than the last, and there is neither evidence of a plan nor evidence of awareness that a plan is needed. The apparent obliviousness of the risks presented to the global economy by Bernanke's post-American Financial Crisis policies lends a sense of unreality to the economic scene in 2014. more...
iTulip Select: The Investment Thesis for the Next Cycle�
__________________________________________________
To receive the iTulip Newsletter or iTulip Alerts, Join our FREE Email Mailing List
Copyright � iTulip, Inc. 1998 - 2014 All Rights Reserved
All information provided "as is" for informational purposes only, not intended for trading purposes or advice. Nothing appearing on this website should be considered a recommendation to buy or to sell any security or related financial instrument. iTulip, Inc. is not liable for any informational errors, incompleteness, or delays, or for any actions taken in reliance on information contained herein. Full Disclaimer


Comment