Announcement

Collapse
No announcement yet.

Case-Shiller Housing Charts - Long-term, etc.

Collapse
X
 
  • Filter
  • Time
  • Show
Clear All
new posts

  • #16
    Re: Case-Shiller Housing Charts - Long-term, etc.

    a bubble causes people to spend more than they earn. how to create demand in a capitalist world that does its best to constrain it 101.

    Comment


    • #17
      Re: Case-Shiller Housing Charts - Long-term, etc.

      Thanks bart. It's interesting to see the differences between CPI-adjusted and SGS-adjusted.

      Comment


      • #18
        Re: Case-Shiller Housing Charts - Long-term, etc.

        June / Q2 2010 Case-Shiller update

        A gain from last quarter brings the national numbers back up to about where they were in Q3 2009. The next quarter will probably see a decline resulting from the expired tax credit and falling sales counts as reported by the NAR.


        Comment


        • #19
          Re: Case-Shiller Housing Charts - Long-term, etc.

          Originally posted by zoog View Post
          My guess, and it is only a guess, is that housing prices will be rangebound until the next recession, fluctuating in the usual seasonal patterns.
          Originally posted by zoog View Post
          June / Q2 2010 Case-Shiller update

          A gain from last quarter brings the national numbers back up to about where they were in Q3 2009. The next quarter will probably see a decline resulting from the expired tax credit and falling sales counts as reported by the NAR.
          And so here we are with the September / Q3 2010 update and a small decline from last quarter. This is probably seasonal more than anything else. Bear in mind that because the Case-Shiller indexes are three-month averages, the September numbers are influenced by July and August sales. Q4 will likely be a similar or larger decline as the fall and winter season tends to be slow for the housing market and generally prices drop accordingly.


          Comment


          • #20
            Re: Case-Shiller Housing Charts - Long-term, etc.

            Originally posted by zoog View Post
            ...Q4 will likely be a similar or larger decline as the fall and winter season tends to be slow for the housing market and generally prices drop accordingly.
            Q4 2010 Update

            The nominal Case-Shiller national index has fallen 31.35% from the peak, nearly dropping to the low point of -31.99% back in Q1 2009. It seems likely that Q1 2011 will set a new post-peak low.


            The inflation-adjusted index is down 37.39% from the peak, setting a new post-peak low. The previous low was Q1 2010 at -36.11%.


            Atlanta, Chicago, Charlotte, Detroit, Las Vegas, Miami, New York, Phoenix, Portland, Seattle, and Tampa have all set new lows.


            Atlanta, Cleveland, and Las Vegas have slipped below their January 2000 levels. Detroit is well on the way towards 50% below that point.


            NOTE: Periodically, Standard and Poors / Case Shiller reworks the data in their series. When I replace the numbers in my spreadsheets, this can result in changes in the percentages that I report. Usually only fractions of a percent. If you go back and look at my earlier posts for Q1 2009 and Q1 2010, for example, you will see I reported slightly different percentage drops from the peak for the national series.

            Comment


            • #21
              Re: Case-Shiller Housing Charts - Long-term, etc.

              Originally posted by zoog View Post
              Q4 2010 Update

              The nominal Case-Shiller national index has fallen 31.35% from the peak, nearly dropping to the low point of -31.99% back in Q1 2009. It seems likely that Q1 2011 will set a new post-peak low.
              Q1 2011 Update

              As expected, the nominal index has set a new low, now 33.97% below the peak. If Q2 does not show a recovery then the second major drop has begun.


              The CPI-adjusted index has dropped 40.93% from the peak.


              City charts to follow...

              ... Atlanta, Chicago, Charlotte, Cleveland, Detroit, Las Vegas, Miami, Minneapolis, New York, Phoenix, Portland, and Tampa have all set new lows. Boston, Dallas, Denver, and Seattle are only barely above their lowest months.


              Atlanta, Cleveland, Detroit, and Las Vegas are still below their January 2000 levels. Phoenix is 0.27% above.


              Atlanta, Chicago, Las Vegas, Minneapolis, and Phoenix all have one or more tiers below their January 2000 levels. Low-end homes in Atlanta have fallen further below that level than they gained during the boom.
              Last edited by zoog; May 31, 2011, 09:28 PM. Reason: added city charts

              Comment


              • #22
                Re: Case-Shiller Housing Charts - Long-term, etc.

                Originally posted by zoog View Post
                Thanks bart. It's interesting to see the differences between CPI-adjusted and SGS-adjusted.
                You're most welcome.

                The most interesting part to me is how close we are to the all time low in the early 1920s, and already lower than the Great Depression's low.

                By the way, that's not the SGS - I calculate it myself now. The SGS numbers are significantly higher than mine and would show housing is at a record low - by far.
                http://www.NowAndTheFuture.com

                Comment


                • #23
                  Re: Case-Shiller Housing Charts - Long-term, etc.

                  Originally posted by zoog View Post
                  Q1 2011 Update

                  As expected, the nominal index has set a new low, now 33.97% below the peak. If Q2 does not show a recovery then the second major drop has begun.
                  A small recovery in Q2 2011, with the nominal index now at -31.49% and the CPI-adjusted index at -39.32%. Three quarters down, one quarter up... the overall trend is still down, but we have yet to see another dramatic plunge.


                  Comment


                  • #24
                    Re: Case-Shiller Housing Charts - Long-term, etc.

                    For what its worth:


                    The Stages of the Real Estate Cycle

                    1. Population growth and commercial growth at the early stage of the economic cycle, often supported by government encouragement/ low interest rates, creates an increase in the demand for housing and commercial buildings in excess of current supply.
                    2. It takes time for construction to gear up. This construction increases demand for vacant land. Bank loans are attracted to construction and real estate sales as prices begin to rise.
                    3. As vacant land prices rise a boom in land develops, leading to sub-divisions and speculative resale.
                    4. The real estate cycle peak is characterized by a high volume of subdivision and sales.
                    5. Construction catches up with demand and a small surplus is created. Rents can't go up enough to support the higher property costs, making new construction and rental property investment unprofitable. Land values start to adjust downwards, the bubble/mania is broken.
                    6. Rising interest rates hurt confidence and profits, adding to the downwards pressure on prices. Real estate enters a 'hanging' slow phase. Asking prices stay high but there are few buyers. Building, subdivisions, and speculation drops quickly. Sometimes a panic or crash begins at this point; often the market just slowly dies. Many keep speculating during this phase as they're unaware of the market having turned.
                    7. Real estate starts to get marked down in price. This tends to take quite a while as owners tend to cling to mortgaged property longer than they would to other assets, like shares. Foreclosures rise but the foreclosure process is not quick.
                    8. Mortgage costs/interest rates are higher, rents decline, and vacancies increase. The market is dying rapidly. Foreclosures increase; speculators and investors are forced to sell as the capital value of their property decreases below lending margins and rents decrease below holding costs.
                    9. The bottom of the market has the following characteristics: high vacancies, low construction rates, foreclosures and no speculation. Debt must be written off and properties sell at a deep discount. Only those who entered stage 6 with little or no debt survive to buy the dramatically discounted properties.

                    • Note that in a typical real estate cycle that non-residential (commercial & industrial) real estate follows residential trends with a time lag of about 5 quarters (the historical range is 3-8 quarters).
                    http://www.NowAndTheFuture.com

                    Comment


                    • #25
                      Re: Case-Shiller Housing Charts - Long-term, etc.

                      Where are we at now? 7?

                      Comment


                      • #26
                        Re: Case-Shiller Housing Charts - Long-term, etc.

                        Originally posted by aaron View Post
                        Where are we at now? 7?
                        Number 8, and I'm tentatively looking at a bottom in Q1 2012 - measured in nominal dollars, 30 year mortgage, 20% down.


                        I also think that using regular CPI for a correction factor can be misleading when looking at the longer term.
                        Last edited by bart; August 31, 2011, 01:21 PM.
                        http://www.NowAndTheFuture.com

                        Comment


                        • #27
                          Re: Case-Shiller Housing Charts - Long-term, etc.

                          Originally posted by zoog View Post
                          A small recovery in Q2 2011, with the nominal index now at -31.49% and the CPI-adjusted index at -39.32%. Three quarters down, one quarter up... the overall trend is still down, but we have yet to see another dramatic plunge.


                          ...

                          Truly very nice chart work zoog... but the one above threw me.

                          Current National Index values are around 130. Did you adjust them upwards since 1987 to align with Shiller's data pre 1987?

                          edit/add - ooops, just looked again. I see you're basing both items at 10 in Q1 1900


                          edit/add: similar chart, including CPI & CPI w/o lies

                          Last edited by bart; August 31, 2011, 01:55 PM.
                          http://www.NowAndTheFuture.com

                          Comment


                          • #28
                            Re: Case-Shiller Housing Charts - Long-term, etc.

                            Originally posted by bart View Post
                            Number 8, and I'm tentatively looking at a bottom in Q1 2012 - measured in nominal dollars, 30 year mortgage, 20% down.
                            I also think that using regular CPI for a correction factor can be misleading when looking at the longer term.
                            Interesting that you say 8. Rates are still rock bottom aren't they, and I'm not sure that foreclosures are increasing very rapidly. I'm saying that from the standpoint that I watch the So Cal market quite a bit since I used to live there. Prices along the coast are still significantly up over 2001-2 prices (even taking nominal dollars into account) and I'm sure it's because rates are so low and banks are really dragging their feet to foreclose and get the market moving.

                            I'm guessing you're talking on a national scale? There are probably places that will bottom next year but So Cal seems at least a couple years away.

                            Comment


                            • #29
                              Re: Case-Shiller Housing Charts - Long-term, etc.

                              Originally posted by bart View Post
                              Originally posted by zoog View Post
                              Truly very nice chart work zoog... but the one above threw me.

                              Current National Index values are around 130. Did you adjust them upwards since 1987 to align with Shiller's data pre 1987?

                              edit/add - ooops, just looked again. I see you're basing all three items at 10 in Q1 1900
                              Was writing my reply but I see you noted the 10.

                              I first set this chart up in late 2007, so my memory is a little fuzzy...

                              I was working with three different series, the shiller housing index (which is fixed to 100 in Q1 2000), the US population in millions, and the consumer price index series CPI-U, which is supposedly set to 100 in "1982-1984" (
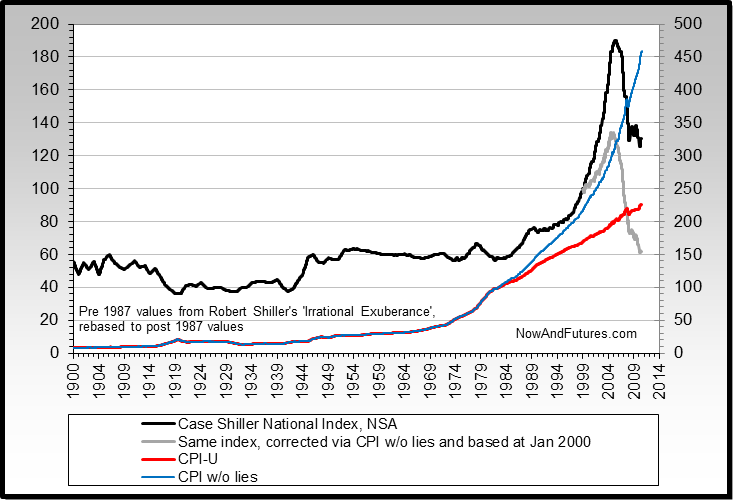
). I reconfigured the housing index to start at 10 in 1900 so that it more closely aligned with the CPI-U series, to illustrate Shiller's conclusion that over the long term, housing prices roughly track inflation, and should eventually return to the inflation line. (Of course you and I both believe the CPI understates inflation, but that's another can of worms.) The adjustments also caused the series to go from nearly the bottom of the chart to the top. So it was also an aesthetic choice. What's the saying, "numbers don't lie, but charts can". Any graphic representation is going to be subjective.

                              Here is the chart with the housing index set to 100 in Q1 2000. The percentage drop is still the same, of course.

                              Comment


                              • #30
                                Re: Case-Shiller Housing Charts - Long-term, etc.

                                Originally posted by CanuckinTX View Post
                                Interesting that you say 8. Rates are still rock bottom aren't they, and I'm not sure that foreclosures are increasing very rapidly. I'm saying that from the standpoint that I watch the So Cal market quite a bit since I used to live there. Prices along the coast are still significantly up over 2001-2 prices (even taking nominal dollars into account) and I'm sure it's because rates are so low and banks are really dragging their feet to foreclose and get the market moving.

                                I'm guessing you're talking on a national scale? There are probably places that will bottom next year but So Cal seems at least a couple years away.

                                Yes, I'm talking on national basis and I also don't expect any rocket rides off the bottom.

                                Rates being close to a 50 year record low are part of it too (15 year fixed is around 3.75%), as well as your observation about foreclosures. REO inventories are also going down and a few articles have started to appear about how awful owning or buying a house is, plus the cost of renting is getting close to owning - and even above it in many places. Lots more than normal purchases for cash, and foreigners purchases are becoming more significant too.

                                Hard to say on SoCal, its nutty much like Vegas. The super high quality stuff like on the beaches on in Big Sur won't drop much more if any... best guess.


                                For what its worth:


                                http://www.NowAndTheFuture.com

                                Comment

                                Working...
                                X