Announcement

Collapse
No announcement yet.

Majority of under-35s can't afford own home

Collapse
X
 
  • Filter
  • Time
  • Show
Clear All
new posts

  • #16
    Re: Majority of under-35s can't afford own home

    I just looked at all this again last week. I've got a ridiculous deal ($1000) on a small older stock apartment in the most bubbilicious part of Arlington, VA, but was trying to decide on moving into a nicer apt ($1700-1800) or buy.

    Including all expenses, savings and tax deductions, renting the nicer place was still a better deal than owning a similar ($425k) condo unless you held it for ~6 years. And that's assuming you get out for what you paid when you want to sell. With no real upside reward potential.

    Since I can't afford something I'd be comfortable living in for at least ten years, I decided to furnish the house I'm not buying yet with the money I'm saving by sitting tight in a smaller apartment.

    Comment


    • #17
      Re: Majority of under-35s can't afford own home

      Originally posted by EJ
      That's the $100 trillion bonar question. Rick Ackerman and I are working out an audio debate, with Rick on the deflation side and yours truly on the inflation side. For those of us who have been tracking this question for, oh, eight years or so, it's becoming its own special kind of extreme practice of mortification of the brain flesh. Maybe Rick and I can erect some sign posts so at least we know where we are in either process.


      Hey, EJ, are you making any progress with working out the audio debate with Rick Ackerman? I do not know who Rick is, but if you think his notions on deflation are worth "deflating," I would like to hear the "deflate." What are the prospects of its coming to fruition?

      I think it was the notion of erecting "some sign posts so at least we know where we are in either process" that stuck in my mind as something I need to know or need to know how you guys see it.
      Last edited by Jim Nickerson; February 05, 2007, 11:57 AM.
      Jim 69 y/o

      "...Texans...the lowest form of white man there is." Robert Duvall, as Al Sieber, in "Geronimo." (see "Location" for examples.)

      Dedicated to the idea that all people deserve a chance for a healthy productive life. B&M Gates Fdn.

      Good judgement comes from experience; experience comes from bad judgement. Unknown.

      Comment


      • #18
        Re: Majority of under-35s can't afford own home

        Rick and I are still in email foreplay. Ball's in his court as to when we get down to business.

        Comment


        • #19
          Re: Majority of under-35s can't afford own home

          Originally posted by JamesP
          If you were to only consider new home prices, and subtract out the huge incentives used to move homes today, then prices might be back to 2004 levels....
          Very possibly... and the raw OFHEO data just corrected by the heinously understated CPI shows median housing is now back to close to 2004 levels.

          http://www.NowAndTheFuture.com

          Comment


          • #20
            Re: Majority of under-35s can't afford own home

            Bart... what do those numbers in the blue on the right signify?

            Comment


            • #21
              Re: Majority of under-35s can't afford own home

              Originally posted by DemonD
              Bart... what do those numbers in the blue on the right signify?
              That's the scale on which both the blue and green lines should be read. In other words, the (Base 1963=100) starting price was about $17,500 and the 3rd quarter 2006 CPI adjusted price is about $35,000 (the 2006 CPI+lies adjusted price is about $21,000). The CPI correction/lies factors come from John Williams at shadowstats.com.

              The "rhs" in the legend stands for right hand scale. Would it have helped if I'd spelled right hand scale out?
              http://www.NowAndTheFuture.com

              Comment


              • #22
                Re: Majority of under-35s can't afford own home

                Originally posted by bart

                The "rhs" in the legend stands for right hand scale. Would it have helped if I'd spelled right hand scale out?
                Thanks, and the answer to your question is yes (not sure if that is sarcastic or not but I'm giving you a non-sarcastic real answer).

                Admittedly I have a really hard time making heads or tails out of a lot of your charts, but this one I could read and understand.

                Comment


                • #23
                  Re: Majority of under-35s can't afford own home

                  Originally posted by DemonD
                  Thanks, and the answer to your question is yes (not sure if that is sarcastic or not but I'm giving you a non-sarcastic real answer).

                  Admittedly I have a really hard time making heads or tails out of a lot of your charts, but this one I could read and understand.
                  Thanks, and yes it was an honest question - sorry for being unclear on that. I've never had any training in charting and I've known for a while that it does show with many of my charts.

                  Now that I've created the majority of the ones I originally wanted to, the next major step is to make them a lot less complex and/or intimidating. That includes better labels, more explanation on the chart itself and sometimes splitting up a single chart into multiple ones.

                  Given that there are hundreds of them, it'll take a while and I'm testing some of the concepts (like colored scales when there's more than one scale) to see what will make them communicate better.

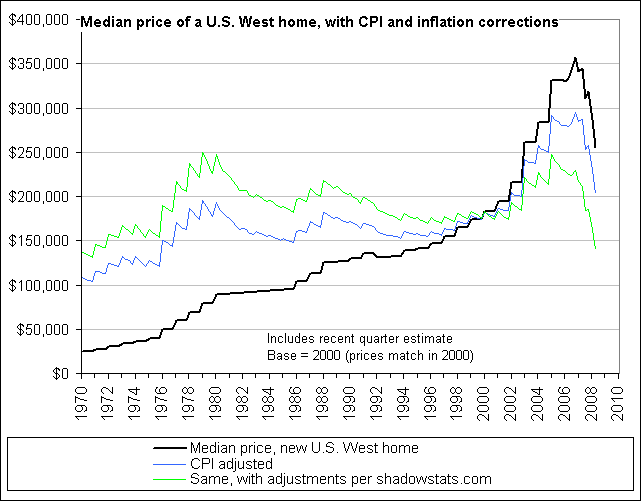
                  Here's the same chart except it's been enhanced with more descriptive data, etc. and is also only showing the U.S. West region. Does it communicate clearly and cleanly now?

                  http://www.NowAndTheFuture.com

                  Comment


                  • #24
                    Re: Majority of under-35s can't afford own home

                    Bart, that is a better chart, and I continue to appreciate your hard work and time to share it.

                    Originally posted by Bart
                    Now that I've created the majority of the ones I originally wanted to, the next major step is to make them a lot less complex and/or intimidating. That includes better labels, more explanation on the chart itself and sometimes splitting up a single chart into multiple ones.
                    If you were running for office and your platform was that underlined above, you would have my vote enduringly. Those all worthy goals and will make things easier for a lot of us.
                    Jim 69 y/o

                    "...Texans...the lowest form of white man there is." Robert Duvall, as Al Sieber, in "Geronimo." (see "Location" for examples.)

                    Dedicated to the idea that all people deserve a chance for a healthy productive life. B&M Gates Fdn.

                    Good judgement comes from experience; experience comes from bad judgement. Unknown.

                    Comment


                    • #25
                      Re: Majority of under-35s can't afford own home

                      Originally posted by Jim Nickerson
                      Bart, that is a better chart, and I continue to appreciate your hard work and time to share it.
                      My pleasure Jim, and thanks very much for your kind words.


                      Originally posted by Jim Nickerson
                      If you were running for office and your platform was that underlined above, you would have my vote enduringly. Those all worthy goals and will make things easier for a lot of us.
                      Well, at least I didn't get called Sinister... ;)

                      Seriously though, if I would have known 18 months ago that my site would be getting the many millions of hits it has been getting, I would have done my charting very differently. I almost dropped my research and concentrated on clean up and clarity last year but decided that stuff like TIOs and the majority of central banks and even the ECB gold manipulation data was better to get out there, even though many or most would not find them very useful.

                      It actually takes longer to clean one up than it took to build it in the first place.

                      Is there any particular chart that you'd like to see broken up into multiples first?

                      Any other suggestions?
                      http://www.nowandfutures.com/grins/bueller.wav ... ;)
                      http://www.NowAndTheFuture.com

                      Comment


                      • #26
                        Re: Majority of under-35s can't afford own home

                        bart, have you ever seen tufte's visual display of quantitative information? some of his charts are really amazing, the book is fun and might give you some ideas.

                        http://www.amazon.com/Visual-Display...e=UTF8&s=books

                        Comment


                        • #27
                          Re: Majority of under-35s can't afford own home

                          Originally posted by bart
                          My pleasure Jim, and thanks very much for your kind words.
                          Well, at least I didn't get called Sinister... ;)

                          Seriously though, if I would have known 18 months ago that my site would be getting the many millions of hits it has been getting, I would have done my charting very differently. I almost dropped my research and concentrated on clean up and clarity last year but decided that stuff like TIOs and the majority of central banks and even the ECB gold manipulation data was better to get out there, even though many or most would not find them very useful.

                          It actually takes longer to clean one up than it took to build it in the first place.

                          Is there any particular chart that you'd like to see broken up into multiples first?

                          Any other suggestions?
                          http://www.nowandfutures.com/grins/bueller.wav ... ;)
                          Well, Finster really isn't Sinister, but I like Sinister because it has meaning, and sometimes for me the meanings put forth by Finster are hard to grasp, and that isn't a serious criticism. By the way, what ever happened to Finster, he's seemingly disappeared. Do you think I offended him? I didn't mean to do so. I apologize if I did. "Come back, come back, Finster."

                          It's easy to critcise others especially when it is they who must do the work to remedy criticism. Bart, I am not buttering your breed here, but I was and continue to be flabbergasted at the extent of your web-site. How anyone could do anything else in life while at the same time assembling all you have is beyond me, but you have done it.

                          After three lines in most charts, I think they can fail to be a picture worth a thousand words. Three lines are good if possible. I personally have difficulty with very thin, light-colored lines and moreso when they are broken. What I think is important is secondary to what you think, you know that, it is your time and your work that is at play. I always am looking forward to your next creation and the often esoteric nature of what you track.
                          Jim 69 y/o

                          "...Texans...the lowest form of white man there is." Robert Duvall, as Al Sieber, in "Geronimo." (see "Location" for examples.)

                          Dedicated to the idea that all people deserve a chance for a healthy productive life. B&M Gates Fdn.

                          Good judgement comes from experience; experience comes from bad judgement. Unknown.

                          Comment


                          • #28
                            Re: Majority of under-35s can't afford own home

                            Originally posted by bart
                            Thanks, and yes it was an honest question - sorry for being unclear on that. I've never had any training in charting and I've known for a while that it does show with many of my charts.

                            Now that I've created the majority of the ones I originally wanted to, the next major step is to make them a lot less complex and/or intimidating. That includes better labels, more explanation on the chart itself and sometimes splitting up a single chart into multiple ones.

                            Given that there are hundreds of them, it'll take a while and I'm testing some of the concepts (like colored scales when there's more than one scale) to see what will make them communicate better.

                            Here's the same chart except it's been enhanced with more descriptive data, etc. and is also only showing the U.S. West region. Does it communicate clearly and cleanly now?
                            Bart, it does, but it's not totally 100% clear what everything means to me. Let me give some (hopefully) constructive criticism from my viewpoint

                            1. You start with base = 100. But there is no "100" on the chart. Also that starts in 1963. There is no 1963 on there. I understand you are describing that in words what base means, but base = 100 should mean that your measurements are all starting at a literal value of 100. If you had started the chart in 1963, with all the lines starting there, you would likely not need to specify base = 100, but could say "base year of 1963."

                            A good example of this chart that I can clearly understand is the chart EJ brings up regarding inflation, with lines for health care, college tuition, and televisions (among other items). All numbers start at literally 100 on that chart. But the numbers aren't raw numbers, they are percentages. Usually if you are using a base = 100 you are working with percentage (remember, "per cent" means "portion of 100" in latin).

                            2. The label on the left hand y-axis would be best put on top of that axis, not in the middle of the chart.

                            3. There is no label for the right hand side y-axis. Yes it's in blue, but what is it referring to? Median salary? Mean salary? Home equity? Some kind of tangible measure must be used to show inflation... there is no label to indicate what that axis is. Or is it an aggregate of all CPI measures? I'm just not sure what it is referring to.

                            The good:

                            The color schemes and better labeling on the second chart make it definitely clearer and easier to see. The use of right and left hand scales are done well. The labeling of the second chart (outside of the above criticisms) are placed and described well.

                            Just an FYI, I wrote this post for constructive criticism purposes; I think you do a great job creating the charts, so hopefully these suggestions can help you improve what you've got going for you.

                            Comment


                            • #29
                              Re: Majority of under-35s can't afford own home

                              bart, i think the chart is readable and the labelling ok just as it is. i've got a different problem with it: the median house in 2006 is likely a very different house than that of 1963- square footage, amenities, lot size, appliances, are all likely quite different. looking at the chart, specifically the price deflated by cpi+lies, i think " housing hasn't moved in price at all since about 1980." but if the house itself is really different, then i can't conclude that. that's not your fault, of course. the median price is the median price, and it would take another whole layer of analysis to try to tease out, e.g., whether there has in fact been deflation because the 2006 house is more house than the 1980 house was.

                              Comment


                              • #30
                                Re: Majority of under-35s can't afford own home

                                Originally posted by jk
                                bart, have you ever seen tufte's visual display of quantitative information? some of his charts are really amazing, the book is fun and might give you some ideas.

                                http://www.amazon.com/Visual-Display...e=UTF8&s=books

                                Thanks jk, I just read the reviews and ordered it. It sure should help my efforts.
                                http://www.NowAndTheFuture.com

                                Comment

                                Working...
                                X