 Tweet
Tweet
Re: Does USA 2009 = Argentina 2001? Part I: Falling economy reaches terminal velocity - Eric Janszen
It sure will be interesting to see if the US is able to formally and unilaterally depreciate the dollar again in a world in which every country is fending off an economic meltdown and has no interest in seeing their own exports crash to save the US. How many military bases do we have again? ;)
And there's no evil Soviet beast lurking this time...
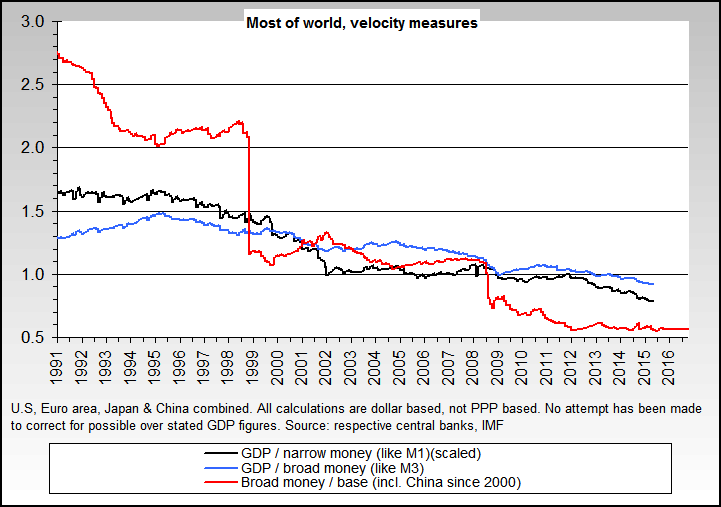
As for Argentinian velocity, did it pick up just before inflation started, or just after? I guess another way to frame the question is whether another event (printing?) got the ball rolling and subsequently velocity took price level into the stratosphere or if a velocity shift was the inciting inflationary event. Difficult and possibly unanswerable, I know. When did they start printing in force?
Originally posted by bart
View Post
And there's no evil Soviet beast lurking this time...
As for Argentinian velocity, did it pick up just before inflation started, or just after? I guess another way to frame the question is whether another event (printing?) got the ball rolling and subsequently velocity took price level into the stratosphere or if a velocity shift was the inciting inflationary event. Difficult and possibly unanswerable, I know. When did they start printing in force?
 ) this time, a short time looking around in tinfoil hat mode will show a lot more beasts available and waiting.
 and hopefully don't piss off the govmint in the interim...

Comment