 Tweet
Tweet
Failed US regime: the vagaries of U3 and U6 data...
From:
http://www.doctorhousingbubble.com/u...te-for-2008-1/
Finding the True Unemployment Rate: Is the Government Listening to Financial Bloggers? Bureau of Labor and Statistics now has Annual U-6 Data for Individual States.
California U-6 Rate for 2008? It is 13.4 Percent.
Many long time readers know that I have had issues in how the media and government report the unemployment numbers. It is sugarcoated, put in a silky dress, and has lipstick before it is dished out for everyone to eat at the happy days buffet.
The good news is that recently the media has been catching on and using the wider measure of unemployment (not always), normally recognized as the U-6 data in the Bureau of Labor Statistics releases since this provides a more accurate assessment of the unemployment situation for the average person and family. That isn�t necessarily the big news. One of the main data points that I have been searching for is the U-6 data for individual states. The BLS as of March 16, 2009 now has the annual data for states including U-6.
As you are aware, the national employment figures are calculated via the Current Population Survey (CPS) that samples 60,500 eligible households. However, for state sub-samples the data can range from 600 to 4,000 households depending on what state is being surveyed. We still don�t have monthly data at the BLS regarding individual states but having the annualized data does help us arrive at a more accurate level for unemployment. What we are finding is that we are approaching Great Depression levels of unemployment.
Before going on, let me add a couple of caveats since everyone thinks that simply uttering the Great Depression means we are flying off some kind of economic cliff. People anchor on to the dismal 25 percent unemployment peak but fail to realize that in some years, unemployment was hovering around 15 percent.
The Great Depression lasted an entire decade with major fluctuations in employment and also saw the stock market bounce off record lows. GDP also increased. It was not all doom and gloom. In addition, we have much more of a safety net today including unemployment insurance which provides a minor buffer to employment shocks.
Yet this hasn�t stopped tent cities from popping up including one in Sacramento that is being shut down. The purpose of looking at the data is to get a more accurate assessment of what is going on in our economy. An 8.1 percent unemployment does not warrant trillions in bailouts, printing money, and virtually throwing every piece of monetary and fiscal stimulus at it as the Federal Reserve and U.S. Treasury have. Yet a 20 percent unemployment rate may warrant massive action like during the Great Depression.
[...]
I sorted out this data in Excel to paint a clearer picture. Let us spend some time on this chart because it is really important. First, the widely reported mainstream unemployment data is the U-3 column. Most have taken this at face value.
Yet the broader and more accurate number in my opinion is the U-6 data because it includes part-time workers looking for full-time work and those looking for work, but have given up. I think it is fair to say that those people should not be calculated as fully employed. If anything, they are underemployed but we do not have a column for that so we need to draw our own conclusions where the data is missing.
On an annualized basis for 2008, both Michigan and California have the highest unemployment rates. Michigan is at 15.1 percent (depression level) and California is at 13.4 percent. Keep in mind that this data is annualized and is skewed to include the first 8 months of the year before job losses really accelerated.
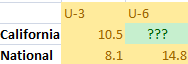
In fact, this data has California unemployment via the U-3 at 7.1 percent on an annualized basis. On Friday state level data was released for February of 2009 and the unemployment rate for California now stands at 10.5 percent via the U-3 measure.
So why is this annualized state data important? Because it gives us a deeper view of what states are taking the brunt of this economic downturn. The BLS states that it does not give monthly data on all the U-1 through U-6 measures because state sample sizes fluctuate too much and don�t provide a good statistical sample. Yet things are quickly changing since the last few months have seen drastic jumps in unemployment.
What this means is we will have to wait until 2010 to get an overall picture of the real unemployment feel for states but we don�t have to wait since we can arrive at a relatively accurate number on our own. There is enough data out there that we can triangulate various sources and arrive at an accurate assessment of the unemployment situation without waiting a full year for the final verdict.
[...]
The current unemployment rate is 8.1 percent but if you look at U-6, nationally we are already at 14.8 percent.
This is a very big difference. And as I had suspected when we look at the above annualized data for each state, U-6 data is much higher than the headline number (of course).
U-3 and U-6 should have a positive correlation so we can try to assess the unemployment ratio for each state. Let us take California for example and measure it to the national breakdown:
So we�re really trying to solve for the U-6 here for California.
If anything, we can arrive at a really generic ratio:
8.1 / 14.8 = .54 (national data for February of 2009)
7.1 / 13.4 = .52 (annualized U-3 vs U-6 California data for 2008)
[...]
The ratio is extremely tight. It falls within a range of .47 to .66. So now you understand why the entire 2008 U-6 annualized data is so important because it now allows us to project U-6 estimates for each state. Let us use that .47 to .66 range and also, look at the average for California:
10.5% / ??? = 54%
??? = 19.1% for California U-6 using a .54 ratio
If we used the .47 ratio you are looking at 22 percent unemployment via the U-6 data or the higher ratio of .66 which gives us 16 percent. This is actually giving us a more accurate picture and why things are so dire including the fiscal problems that the state is facing. And these numbers make sense.
If an annualized rate of 7.1 percent U-3 for the state rate gave us a U-6 of 13.4 percent, then is it hard to believe that a 10.5 percent U-3 rate would give us a 16 to 19 percent U-6 rate? That is why things are feeling much worse for the state.
[...]
The reason this exercise is so important is that we have government official using U-3 measures to project out earnings and revenues and are falling drastically short. That is why we had an $8 billion budget short fall only three weeks after the budget had passed.
Why did this occur?
They were projecting 9.1 percent statewide unemployment for 2009 and a peak of 9.4 percent for 2010. We�re already at 10.5 percent with the headline number! As they say, garbage in and garbage out.
Unless you are using proper assumptions your projections will be false and that is why the majority failed to see the housing bubble when it was expanding. Many now fail to realize that we will not see a housing bottom until 2011 for the state and this rising unemployment is a direct reason. People are fixated on prices now. Well who is going to buy when virtually 2 out of every 10 people are out of work if we use better measures of unemployment?
MarketWatch has an article looking at the fact that many Americans are one or two paychecks away from financial ruin:
�A MetLife study released last week found that 50% of Americans said they have only a one-month cushion � roughly two paychecks � or less before they would be unable to fully meet their financial obligations if they were to lose their jobs. More disturbing is that 28% said they could not make ends meet for longer than two weeks without their jobs.
And it�s not just low-income earners who would find themselves financially challenged. Twenty-nine percent of those making $100,000 or more a year said they would have trouble paying the bills after more than a month of unemployment.
Meanwhile, more than four in 10 respondents told pollsters in a recent Pew Research Center study that job-related issues were the nation�s most important economic problem.
�Since October, mentions of other major economic issues have declined, as the public is increasingly focused on the job situation,� according to the Pew study.
Since July, the study noted, there was been a striking spike in the numbers of families making $100,000 or more who said it was difficult to find local jobs � 73% compared with 40% eight months ago.�
Read the above carefully. 1 in 2 Americans are 2 paychecks away from massive financial trouble. 1 in 4 would be on the financial edge after 2 weeks only. These are fully employed people. This is what I talked about in the silent depression that many are facing.
If you look at the 8.1 percent headline unemployment number things don�t look so bad. But when you dig deeper into the data, you realize something is amiss. In fact, the study above highlights what many are feeling. Things are much worse than we are being led to believe. Why else would the Fed be printing money to the tune of trillions of dollars?
You will also see in the survey that those with relatively good incomes are also worried about the economy. Over 1 in 4 with incomes of $100,000 said they would have trouble paying their bills after one-month of unemployment. How can that be you say? Well think about the bubble homes here in California.
Say you bought a $500,000 home in California and make $100,000. You went no money down on some toxic mortgage that is now recasting. What does your balance sheet look like?
Monthly Net Pay:
$6,022 (Married with no kids)
PITI:
$3,000 to $3,500 depending on interest rate
Let us assume each person makes $50,000 a year. What if one person loses their job? That is it. You are now in the negative with only your PITI! What about your car payment? Food? Health insurance? Utility bills? You get the picture. And now that we know the bigger picture of the California employment situation, you can see why prices will now be falling because of more historical measures like the health of the economy instead of low interest rates.
Let us take a quick glance at the current situation:
February 2009 California employment data
[...]
You tell me how this is good for the housing market? The government through bailouts, fiscal stimulus, monetary programs, and every other imaginable bailout has committed over $9 trillion to the cause.
You know how many $50,000 a year jobs we can buy with that for one year? 180,000,000.
Even with the $1.2 trillion committed by the Fed with the TALF and buying treasuries to lower the interest rate, we could have literally bought 24,000,000 jobs at $50,000 for one year. We could have put everyone back to work for the price of making mortgages go back down to 4% and giving Wall Street another crony capitalist present. Money well spent right?
What are your thoughts on these above measures for employment? Am I too pessimistic? Optimistic? How would you calculate the U-6 for each state on a monthly basis?
From:
http://www.doctorhousingbubble.com/u...te-for-2008-1/
Finding the True Unemployment Rate: Is the Government Listening to Financial Bloggers? Bureau of Labor and Statistics now has Annual U-6 Data for Individual States.
California U-6 Rate for 2008? It is 13.4 Percent.
Many long time readers know that I have had issues in how the media and government report the unemployment numbers. It is sugarcoated, put in a silky dress, and has lipstick before it is dished out for everyone to eat at the happy days buffet.
The good news is that recently the media has been catching on and using the wider measure of unemployment (not always), normally recognized as the U-6 data in the Bureau of Labor Statistics releases since this provides a more accurate assessment of the unemployment situation for the average person and family. That isn�t necessarily the big news. One of the main data points that I have been searching for is the U-6 data for individual states. The BLS as of March 16, 2009 now has the annual data for states including U-6.
As you are aware, the national employment figures are calculated via the Current Population Survey (CPS) that samples 60,500 eligible households. However, for state sub-samples the data can range from 600 to 4,000 households depending on what state is being surveyed. We still don�t have monthly data at the BLS regarding individual states but having the annualized data does help us arrive at a more accurate level for unemployment. What we are finding is that we are approaching Great Depression levels of unemployment.
Before going on, let me add a couple of caveats since everyone thinks that simply uttering the Great Depression means we are flying off some kind of economic cliff. People anchor on to the dismal 25 percent unemployment peak but fail to realize that in some years, unemployment was hovering around 15 percent.
The Great Depression lasted an entire decade with major fluctuations in employment and also saw the stock market bounce off record lows. GDP also increased. It was not all doom and gloom. In addition, we have much more of a safety net today including unemployment insurance which provides a minor buffer to employment shocks.
Yet this hasn�t stopped tent cities from popping up including one in Sacramento that is being shut down. The purpose of looking at the data is to get a more accurate assessment of what is going on in our economy. An 8.1 percent unemployment does not warrant trillions in bailouts, printing money, and virtually throwing every piece of monetary and fiscal stimulus at it as the Federal Reserve and U.S. Treasury have. Yet a 20 percent unemployment rate may warrant massive action like during the Great Depression.
[...]
I sorted out this data in Excel to paint a clearer picture. Let us spend some time on this chart because it is really important. First, the widely reported mainstream unemployment data is the U-3 column. Most have taken this at face value.
Yet the broader and more accurate number in my opinion is the U-6 data because it includes part-time workers looking for full-time work and those looking for work, but have given up. I think it is fair to say that those people should not be calculated as fully employed. If anything, they are underemployed but we do not have a column for that so we need to draw our own conclusions where the data is missing.
On an annualized basis for 2008, both Michigan and California have the highest unemployment rates. Michigan is at 15.1 percent (depression level) and California is at 13.4 percent. Keep in mind that this data is annualized and is skewed to include the first 8 months of the year before job losses really accelerated.
In fact, this data has California unemployment via the U-3 at 7.1 percent on an annualized basis. On Friday state level data was released for February of 2009 and the unemployment rate for California now stands at 10.5 percent via the U-3 measure.
So why is this annualized state data important? Because it gives us a deeper view of what states are taking the brunt of this economic downturn. The BLS states that it does not give monthly data on all the U-1 through U-6 measures because state sample sizes fluctuate too much and don�t provide a good statistical sample. Yet things are quickly changing since the last few months have seen drastic jumps in unemployment.
What this means is we will have to wait until 2010 to get an overall picture of the real unemployment feel for states but we don�t have to wait since we can arrive at a relatively accurate number on our own. There is enough data out there that we can triangulate various sources and arrive at an accurate assessment of the unemployment situation without waiting a full year for the final verdict.
[...]
The current unemployment rate is 8.1 percent but if you look at U-6, nationally we are already at 14.8 percent.
This is a very big difference. And as I had suspected when we look at the above annualized data for each state, U-6 data is much higher than the headline number (of course).
U-3 and U-6 should have a positive correlation so we can try to assess the unemployment ratio for each state. Let us take California for example and measure it to the national breakdown:
So we�re really trying to solve for the U-6 here for California.
If anything, we can arrive at a really generic ratio:
8.1 / 14.8 = .54 (national data for February of 2009)
7.1 / 13.4 = .52 (annualized U-3 vs U-6 California data for 2008)
[...]
The ratio is extremely tight. It falls within a range of .47 to .66. So now you understand why the entire 2008 U-6 annualized data is so important because it now allows us to project U-6 estimates for each state. Let us use that .47 to .66 range and also, look at the average for California:
10.5% / ??? = 54%
??? = 19.1% for California U-6 using a .54 ratio
If we used the .47 ratio you are looking at 22 percent unemployment via the U-6 data or the higher ratio of .66 which gives us 16 percent. This is actually giving us a more accurate picture and why things are so dire including the fiscal problems that the state is facing. And these numbers make sense.
If an annualized rate of 7.1 percent U-3 for the state rate gave us a U-6 of 13.4 percent, then is it hard to believe that a 10.5 percent U-3 rate would give us a 16 to 19 percent U-6 rate? That is why things are feeling much worse for the state.
[...]
The reason this exercise is so important is that we have government official using U-3 measures to project out earnings and revenues and are falling drastically short. That is why we had an $8 billion budget short fall only three weeks after the budget had passed.
Why did this occur?
They were projecting 9.1 percent statewide unemployment for 2009 and a peak of 9.4 percent for 2010. We�re already at 10.5 percent with the headline number! As they say, garbage in and garbage out.
Unless you are using proper assumptions your projections will be false and that is why the majority failed to see the housing bubble when it was expanding. Many now fail to realize that we will not see a housing bottom until 2011 for the state and this rising unemployment is a direct reason. People are fixated on prices now. Well who is going to buy when virtually 2 out of every 10 people are out of work if we use better measures of unemployment?
MarketWatch has an article looking at the fact that many Americans are one or two paychecks away from financial ruin:
�A MetLife study released last week found that 50% of Americans said they have only a one-month cushion � roughly two paychecks � or less before they would be unable to fully meet their financial obligations if they were to lose their jobs. More disturbing is that 28% said they could not make ends meet for longer than two weeks without their jobs.
And it�s not just low-income earners who would find themselves financially challenged. Twenty-nine percent of those making $100,000 or more a year said they would have trouble paying the bills after more than a month of unemployment.
Meanwhile, more than four in 10 respondents told pollsters in a recent Pew Research Center study that job-related issues were the nation�s most important economic problem.
�Since October, mentions of other major economic issues have declined, as the public is increasingly focused on the job situation,� according to the Pew study.
Since July, the study noted, there was been a striking spike in the numbers of families making $100,000 or more who said it was difficult to find local jobs � 73% compared with 40% eight months ago.�
Read the above carefully. 1 in 2 Americans are 2 paychecks away from massive financial trouble. 1 in 4 would be on the financial edge after 2 weeks only. These are fully employed people. This is what I talked about in the silent depression that many are facing.
If you look at the 8.1 percent headline unemployment number things don�t look so bad. But when you dig deeper into the data, you realize something is amiss. In fact, the study above highlights what many are feeling. Things are much worse than we are being led to believe. Why else would the Fed be printing money to the tune of trillions of dollars?
You will also see in the survey that those with relatively good incomes are also worried about the economy. Over 1 in 4 with incomes of $100,000 said they would have trouble paying their bills after one-month of unemployment. How can that be you say? Well think about the bubble homes here in California.
Say you bought a $500,000 home in California and make $100,000. You went no money down on some toxic mortgage that is now recasting. What does your balance sheet look like?
Monthly Net Pay:
$6,022 (Married with no kids)
PITI:
$3,000 to $3,500 depending on interest rate
Let us assume each person makes $50,000 a year. What if one person loses their job? That is it. You are now in the negative with only your PITI! What about your car payment? Food? Health insurance? Utility bills? You get the picture. And now that we know the bigger picture of the California employment situation, you can see why prices will now be falling because of more historical measures like the health of the economy instead of low interest rates.
Let us take a quick glance at the current situation:
February 2009 California employment data
- 116,000 jobs lost in month (biggest number in 19 years)
- 1,950,000 million unemployed (up 824,000 from 1 year ago)
- 768,762 collecting unemployment insurance (up from 480,504 from 1 year ago)
[...]
You tell me how this is good for the housing market? The government through bailouts, fiscal stimulus, monetary programs, and every other imaginable bailout has committed over $9 trillion to the cause.
You know how many $50,000 a year jobs we can buy with that for one year? 180,000,000.
Even with the $1.2 trillion committed by the Fed with the TALF and buying treasuries to lower the interest rate, we could have literally bought 24,000,000 jobs at $50,000 for one year. We could have put everyone back to work for the price of making mortgages go back down to 4% and giving Wall Street another crony capitalist present. Money well spent right?
What are your thoughts on these above measures for employment? Am I too pessimistic? Optimistic? How would you calculate the U-6 for each state on a monthly basis?