 Tweet
Tweet
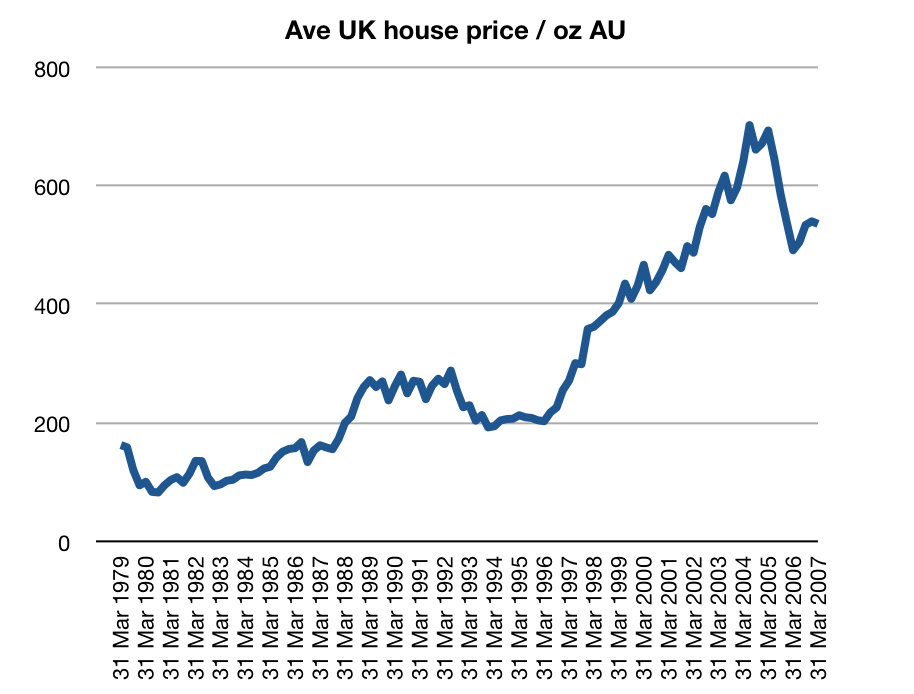
I've attached a chart that traces the median price of a home (nationwide) vs. the # gold (ounces) required to purchase the median home since 1972. I think this is a good general rule of thumb, but does not consider local markets and other factors.
The ratio hit a low mark in 1980 when it took around 73 ounces (when gold hit a high of $850 in 1980, median home was $62,200.00) to purchase the median home. It hit a high in 2001 when it took 545 ounces of gold to buy the median home (home price was $147,800.00, gold was $270)

Today the ratio is roughly around 200, with median home price at $180,000 and gold at $900/ounce. I could see it back at around 100 ounces (or less), with gold at $1,600 and median home price at $160,000. But this ratio could get even lower if the world decides it needs to go back to an international gold standard to fix the imbalances between creditor (Asia) nations, and debtor (U.S.) nations. Or if there is a currency panic, or some other unpredictable event.
Anyway. I think I'll get 50% out of the gold fund I'm in (GLD ) when the ratio hits 100 ounces and buy some real estate, and I'll let the rest of it ride in case gold hits $5,000+ an ounce.
Let me know what you think.
The ratio hit a low mark in 1980 when it took around 73 ounces (when gold hit a high of $850 in 1980, median home was $62,200.00) to purchase the median home. It hit a high in 2001 when it took 545 ounces of gold to buy the median home (home price was $147,800.00, gold was $270)
Today the ratio is roughly around 200, with median home price at $180,000 and gold at $900/ounce. I could see it back at around 100 ounces (or less), with gold at $1,600 and median home price at $160,000. But this ratio could get even lower if the world decides it needs to go back to an international gold standard to fix the imbalances between creditor (Asia) nations, and debtor (U.S.) nations. Or if there is a currency panic, or some other unpredictable event.
Anyway. I think I'll get 50% out of the gold fund I'm in (GLD ) when the ratio hits 100 ounces and buy some real estate, and I'll let the rest of it ride in case gold hits $5,000+ an ounce.
Let me know what you think.
Comment