 Tweet
Tweet
iTulipers jeering at comments from people like Stephen Leeb about the manifest, historically ascertained, even quite banal reality of resource depletion seem almost childish compared to the serious glance taken at the topic of just one commodity - uranium depletion, in the article below. People making rash statements here about "doomers" are using sloppy, vague, opinionated terms like "doomertainment" while elsewhere they are talking glibly about vague unspecified "new technology" that will produce the energy we will be using in the first quarter of the 21st Century to replace petroleum estimated to amount to close to half what the world uses today. A vage reply to this is worthless. If you have a claim about nuclear energy, then debunk this author just for starters! These same easychair critics leave large unanswered questions as to what replaces petroleum in the next 25 years, while they grin and quip affably about the "foolishness" of the rest of us, who worry precisely about how terribly vague you all sound.
How many iTuliper's know in any even sketchy detail, that there are real issues with scaling Uranium production up even remotely adequately to handle what you so dreamily imagine will be mankind's replacement for oil in 25 years? Just who is it here who is demonstrating the beginnings of a grasp of the parameters of the issue? Do we have a grasp of how many BTU's we are talking of replacing in one half of today's global oil consumption? The comments alone seem so grossly simplistic. Here are people, in what presumes to be a community full of genuine skepticism and the spirit of probing curiosity - smirking and kidding around, and yet offering nothing even remotely equivalent to a quantitative reply to the simple question - it is all scoffing conjuring up 5000 notional nuclear reactors that "will get built" within 25 years to replace the equivalent of half of today's petroleum consumption.
Lots of posturing and easy jibes - and "doomertainer" has a nice sardonuic ring to it - very jaunty indeed - while no-one in this little community seems to have a clue that the replacement of all that petroleum by ANY energy - let alone URANIUM - is even assured in this short span of time. Read this brief excerpt from The Oil Drum and then cast your eyes on the pathetic response to Stephen Leeb's expression of vivid concern - which is being most rashly disparaged by people who have utterly failed to offer any detailed alternative more specific than an arm wave towards "human ingenuity". iTulipers come off looking uninformed, opinionated, reactive, even mildly spiteful in a petty fashion, towards any observer having the temerity to speak up on these issues.
Altogether a pathetic, misinformed display here - read even just this cursory overview of the gaping open questions about energy - what will or can step in to provide that 50% of current global annual petroleum consumption in a scant 25 years as 3 billion people inexorably industrialize - whether there is even sufficient Uranium to power the Jetsons future you imagine all rational people must normally envision as "just around the corner". It's easy to see from just skimming through this one article, how utterly inappropriate the smirks here have been regarding Stephen Leeb's own reference to the seriousness of these issues. Doomertainment indeed. Doubtless a real intellectual high point among all the debates on this website.
_______________
Uranium Depletion and Nuclear Power: Are We at Peak Uranium? - Posted on The Oil Drum - on March 21, 2007 - 12:00pm - Miguel Torres
ORIGINAL ARTICLE HERE: http://www.theoildrum.com/node/2379
A ecent post by Martin Sevior has invigorated the nuclear energy debate causing over 240 comments with the most diverse opinions. I would like to further pursue this debate, as the question of whether nuclear power can provide a big part of the worlds energy needs is extremely important in the Peak Oil debate, because it is the only alternative energy source beside coal providing the type of electricity production necessary for the current electric grid model: big, base-load capable power plants. If that role is fulfilled, the current electricity production system can continue beyond Peak Oil, and even expand to provide the energy necessary for electrified transport. If it falls short, a new energy model is needed.
To anyone seeking the truth about the issues surrounding nuclear energy, the situation is extremely frustrating. There are two camps stating opposing claims. On the one hand, the environmentalists dislike everything nuclear, and on the other hand the nuclear industry paints an overly rosy picture where all problems are solvable, or non-issues at all. Whom should we believe?
Because Martin Sevior has portrayed the view of the nuclear industry, this post will explain what the other camp has to say. While I could address his post point by point, it would result in a very large article that nobody would read. So I have opted to first answer just one point, Uranium production, which I chose both because it is most similar to the PO depletion theme, readers should be familiar with some of its challenges, and because a new study sheds new light on it.
The biggest issue I have with nuclear energy proponents, including some members of TOD community, is that they just repeat what the nuclear industry sales men say. A good example is the post by Martin Sevior. It repeats their arguments without a shadow of doubt nor criticism. The same highly educated, Peak Oil literate individuals who know about OPEC resource mis-reporting, and can tell the difference between KSA reserves and Canada's, the difference between light crude oil and tar sands and know who Yergin and CERA are, believe all the arguments of the nuclear industry word by word. Why that is so, I do not know.
TODers should know that even though Canada now has greater stated reserves than KSA, tar sands will never reach OPEC production volumes. Reserves, and R/P ratio is not the same as a production profile, which produces a peak well before complete exhaustion. Uranium, like any other resource, can't be mined at any desired rate, nor every last drop or ounce of the resource can be mined. No matter the technology, at some point it is just not worth it to mine lower grade ores. While energy balance analysis are complicated and a discussion about it would only bring controversy, another way of putting it is more easily grasped. For any mined ore, the lower the grade, the higher the material throughput you need to process. There is always a limit. And despite what the nuclear industry might tell you, for Uranium too.
The materials throughput (not unrelated to the energy needed) is inversely proportional to the ore grade for any mined material: To extract 1 kg of uranium out of 1% ore containing material needs the processing of 100 kg. Extracting the same amount from 0.01% ore needs the processing of 10,000 kg. You can easily see that even if, for the sake of the argument we assume that the EROEI of nuclear energy for all ore grades is positive, there are physical limits to the production throughput Uranium production can ever reach. So what should be done is not just to list possible Uranium reserves, but also to analyze the maximum throughput attainable by the mining industry. That is: The Uranium production profile for the world.
The recently formed Energy Working Group has recently published a paper titled URANIUM RESOURCES AND NUCLEAR ENERGY. I will now explain their work. All figures and quotations are taken from this paper.
About the Energy Watch Group
Uranium Supply
This study uses the same data as the post by Martin Sevior. What he labels "Additional recovarable Uranium" is in reality "undiscovered resources prognosticated" and "undiscovered resources speculative". They are very unreliable data, considered by the study too speculative and with a very low probability of ever being brought into production. While some quantity in that category will be eventually mined, it wouldn't matter much in the time-frame considered.

Figure 1: Reasonably assured (RAR), inferred (IR) and already produced uranium resources
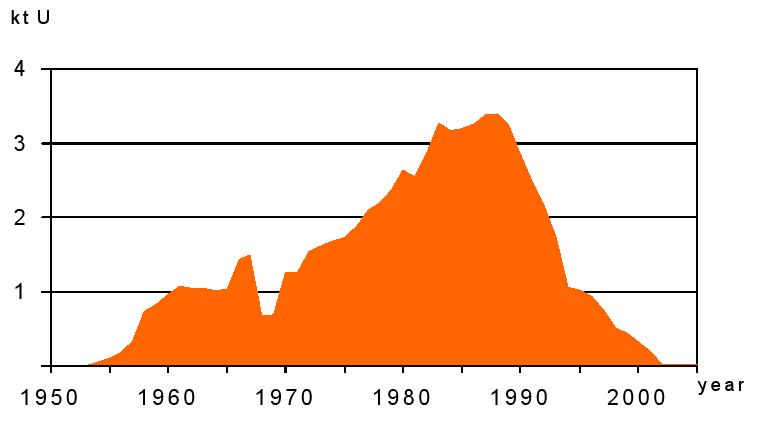
Figure A-3: Uranium production in France
While the USA is not nearly completely depleted like France is, the analysis of historical resource reports reveals similar patterns like the ones shown for France before. Shortly after reaching the production peak, in 1983 the "reasonably assured and inferred resources" where downgraded by 85%, a decline of almost 1,000 kt. The implication is that the reserve reporting practices are not "transparent" and "understated" as the nuclear industry will tell you.
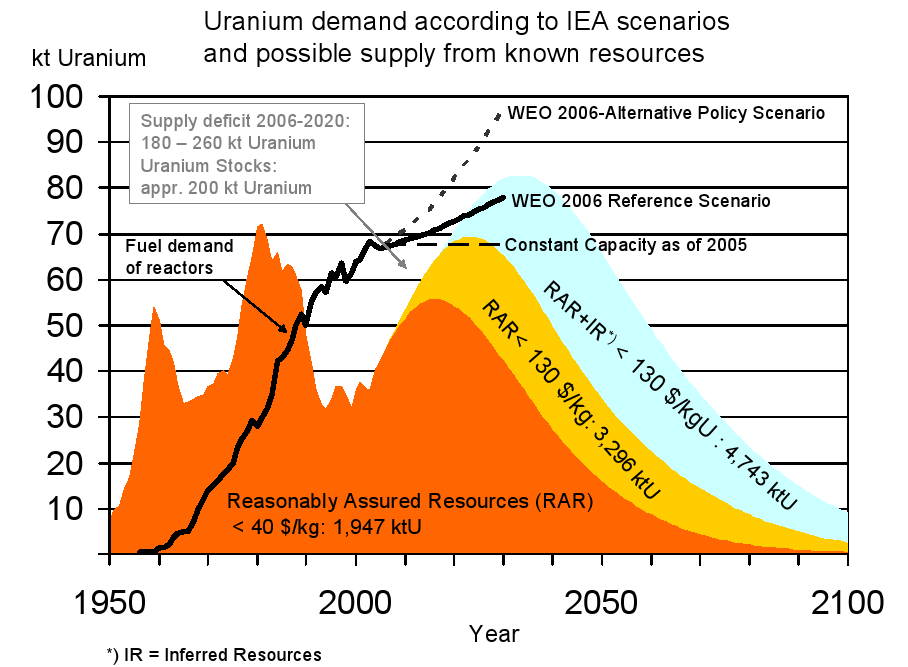
Figure 6: History and forecast of uranium production based on reported resources. The smallest area covers 1,900 kt uranium which have the status of proved reserves while the data uncertainty increases towards the largest area based on 4,700 kt uranium which represents possible reserves.
So it looks like Peak Uranium for this reserve estimates arises before 2040 at the latest, even though reserves will still be available beyond 2100.
In Annex 9 we find a Country by Country Assessment of Future Production Profiles Based on Resource Restriction (According to NEA 2006). Essentially the same as before but with individual countries represented.
On a closing note, Raise The Hammer has posted an interview with Richard Heinberg, known for The Oil Depletion Protocol and his books The Party's Over and Powerdown, where he gives a hint about the second study of the Energy Working Group. Apparently they consider coal reserves to be as overestimated as Oil and Uranium reserves. Heinberg also states that he is tracking an independent Dutch study-in-progress reaching the same conclusions (for coal).
How many iTuliper's know in any even sketchy detail, that there are real issues with scaling Uranium production up even remotely adequately to handle what you so dreamily imagine will be mankind's replacement for oil in 25 years? Just who is it here who is demonstrating the beginnings of a grasp of the parameters of the issue? Do we have a grasp of how many BTU's we are talking of replacing in one half of today's global oil consumption? The comments alone seem so grossly simplistic. Here are people, in what presumes to be a community full of genuine skepticism and the spirit of probing curiosity - smirking and kidding around, and yet offering nothing even remotely equivalent to a quantitative reply to the simple question - it is all scoffing conjuring up 5000 notional nuclear reactors that "will get built" within 25 years to replace the equivalent of half of today's petroleum consumption.
Lots of posturing and easy jibes - and "doomertainer" has a nice sardonuic ring to it - very jaunty indeed - while no-one in this little community seems to have a clue that the replacement of all that petroleum by ANY energy - let alone URANIUM - is even assured in this short span of time. Read this brief excerpt from The Oil Drum and then cast your eyes on the pathetic response to Stephen Leeb's expression of vivid concern - which is being most rashly disparaged by people who have utterly failed to offer any detailed alternative more specific than an arm wave towards "human ingenuity". iTulipers come off looking uninformed, opinionated, reactive, even mildly spiteful in a petty fashion, towards any observer having the temerity to speak up on these issues.
Altogether a pathetic, misinformed display here - read even just this cursory overview of the gaping open questions about energy - what will or can step in to provide that 50% of current global annual petroleum consumption in a scant 25 years as 3 billion people inexorably industrialize - whether there is even sufficient Uranium to power the Jetsons future you imagine all rational people must normally envision as "just around the corner". It's easy to see from just skimming through this one article, how utterly inappropriate the smirks here have been regarding Stephen Leeb's own reference to the seriousness of these issues. Doomertainment indeed. Doubtless a real intellectual high point among all the debates on this website.
_______________
Uranium Depletion and Nuclear Power: Are We at Peak Uranium? - Posted on The Oil Drum - on March 21, 2007 - 12:00pm - Miguel Torres
ORIGINAL ARTICLE HERE: http://www.theoildrum.com/node/2379
A ecent post by Martin Sevior has invigorated the nuclear energy debate causing over 240 comments with the most diverse opinions. I would like to further pursue this debate, as the question of whether nuclear power can provide a big part of the worlds energy needs is extremely important in the Peak Oil debate, because it is the only alternative energy source beside coal providing the type of electricity production necessary for the current electric grid model: big, base-load capable power plants. If that role is fulfilled, the current electricity production system can continue beyond Peak Oil, and even expand to provide the energy necessary for electrified transport. If it falls short, a new energy model is needed.
To anyone seeking the truth about the issues surrounding nuclear energy, the situation is extremely frustrating. There are two camps stating opposing claims. On the one hand, the environmentalists dislike everything nuclear, and on the other hand the nuclear industry paints an overly rosy picture where all problems are solvable, or non-issues at all. Whom should we believe?
Because Martin Sevior has portrayed the view of the nuclear industry, this post will explain what the other camp has to say. While I could address his post point by point, it would result in a very large article that nobody would read. So I have opted to first answer just one point, Uranium production, which I chose both because it is most similar to the PO depletion theme, readers should be familiar with some of its challenges, and because a new study sheds new light on it.
The biggest issue I have with nuclear energy proponents, including some members of TOD community, is that they just repeat what the nuclear industry sales men say. A good example is the post by Martin Sevior. It repeats their arguments without a shadow of doubt nor criticism. The same highly educated, Peak Oil literate individuals who know about OPEC resource mis-reporting, and can tell the difference between KSA reserves and Canada's, the difference between light crude oil and tar sands and know who Yergin and CERA are, believe all the arguments of the nuclear industry word by word. Why that is so, I do not know.
TODers should know that even though Canada now has greater stated reserves than KSA, tar sands will never reach OPEC production volumes. Reserves, and R/P ratio is not the same as a production profile, which produces a peak well before complete exhaustion. Uranium, like any other resource, can't be mined at any desired rate, nor every last drop or ounce of the resource can be mined. No matter the technology, at some point it is just not worth it to mine lower grade ores. While energy balance analysis are complicated and a discussion about it would only bring controversy, another way of putting it is more easily grasped. For any mined ore, the lower the grade, the higher the material throughput you need to process. There is always a limit. And despite what the nuclear industry might tell you, for Uranium too.
The materials throughput (not unrelated to the energy needed) is inversely proportional to the ore grade for any mined material: To extract 1 kg of uranium out of 1% ore containing material needs the processing of 100 kg. Extracting the same amount from 0.01% ore needs the processing of 10,000 kg. You can easily see that even if, for the sake of the argument we assume that the EROEI of nuclear energy for all ore grades is positive, there are physical limits to the production throughput Uranium production can ever reach. So what should be done is not just to list possible Uranium reserves, but also to analyze the maximum throughput attainable by the mining industry. That is: The Uranium production profile for the world.
The recently formed Energy Working Group has recently published a paper titled URANIUM RESOURCES AND NUCLEAR ENERGY. I will now explain their work. All figures and quotations are taken from this paper.
About the Energy Watch Group
This is the first of a series of papers by the Energy Watch Group which are addressed to investigate future energy supply and demand patterns. The Energy Watch Group consists of independent scientists and experts who investigate sustainable concepts for global energy supply. The group is initiated by the German member of parliament Hans-Josef Fell.
SUMMARY Any forecast of the development of nuclear power in the next 25 years has to concentrate on two aspects, the supply of uranium and the addition of new reactor capacity. At least within this time horizon, neither nuclear breeding reactors nor thorium reactors will play a significant role because of the long lead times for their development and market penetration. This assessment results in the conclusion that in the short term, until about 2015, the long lead times of new and the decommissioning of ageing reactors perform the barrier for fast extension, and after about 2020 severe uranium supply shortages become likely which, again will limit the extension of nuclear energy.
I won't discuss the first point here (you may read the whole study, if you so wish) and I will concentrate on the Uranium supply. Uranium Supply
This study uses the same data as the post by Martin Sevior. What he labels "Additional recovarable Uranium" is in reality "undiscovered resources prognosticated" and "undiscovered resources speculative". They are very unreliable data, considered by the study too speculative and with a very low probability of ever being brought into production. While some quantity in that category will be eventually mined, it wouldn't matter much in the time-frame considered.
Figure 1: Reasonably assured (RAR), inferred (IR) and already produced uranium resources
About 2.3 million tons of uranium have already been produced. Reasonably assured resources below 40 $/kgU are in the range of the already produced uranium. At present reactor uranium demand of about 67 kt/year these reserves would last for about 30 years, and would increase to 50 years if the classes up to 130 $/kgU were included. Inferred resources up to 130 $/kg would extend the static R/P ratio up to about 70 years. [...] However, the production profiles and reported reserves of individual countries show major downward reserve revisions in USA and France after their production maximum was passed. These downward revisions raise some doubts regarding the data quality of reasonably assured resources.
It will surely be interesting for TODers to have a look at the depletion curve for uranium in France. It clearly shows that uranium does deplete in a manner not entirely dissimilar to oil. Figure A-3: Uranium production in France
While the USA is not nearly completely depleted like France is, the analysis of historical resource reports reveals similar patterns like the ones shown for France before. Shortly after reaching the production peak, in 1983 the "reasonably assured and inferred resources" where downgraded by 85%, a decline of almost 1,000 kt. The implication is that the reserve reporting practices are not "transparent" and "understated" as the nuclear industry will tell you.
This happened at a time when exploration expenditures reached their highest level. Though the reasons for the production decline in the USA could be manifold, this strong correlation between declining production and downgraded resources is at least interesting. Therefore it is possible that production was declining because of a lack of resources. Apart from this observation, a decline of "reasonably assured resources" is hard to understand, this is to say that in fact the formerly stated resources were not "reasonably assured" after all. A known discovered resource was converted into an unknown undiscovered resource: this does imply that the reporting practice of known resources is highly questionable and unreliable. A decline of 1,000 kt is a relevant quantity which reduces the static R/P-ratio (at 50 kt production) by 20 years.
Back to the big picture. At present, of the current uranium demand of 67 kt/yr only 42 kt/yr are supplied by new production, the rest of about 25 kt/yr is drawn from stockpiles which were accumulated before 1980.If the present reactor capacity remains constant, the annual demand amounts to 67 kt/yr. If the annual production amounts to 45 kt and if 22 kt are taken from stocks, then stocks will be exhausted by 2015 (possible changes due to uranium enrichment and MOX fabrication are marginal). The continuing consumption of 67 kt/yr exceeds the reserves below 40 $/kgU by between 2030 and 2035. The inclusion of reasonably assured resources below 130 $/kgU would exhaust these resources by around 2050. Even the inclusion of the inferred resources below 130 $/kgU would lead to exhaustion of resources by around 2070.
But as any Peak Oiler knows, ultimate reserve exhaustion is not the only important thing. Throughput is as important. Uranium production lends itself to a bottom-up approach to production forecasts probably better than oil. Figure 6: History and forecast of uranium production based on reported resources. The smallest area covers 1,900 kt uranium which have the status of proved reserves while the data uncertainty increases towards the largest area based on 4,700 kt uranium which represents possible reserves.
So it looks like Peak Uranium for this reserve estimates arises before 2040 at the latest, even though reserves will still be available beyond 2100.
In Annex 9 we find a Country by Country Assessment of Future Production Profiles Based on Resource Restriction (According to NEA 2006). Essentially the same as before but with individual countries represented.
In order to ensure the continuous operation of existing power plants, uranium production capacities must be increased considerably over the next few years well before the stocks areexhausted. Rising prices and vanishing stocks have led to a new wave of mine developments. Actually, various projects are in the planning and construction stage which could satisfy the projected demand if completed in time. Annex 7 lists the mines which are planned to be in operation by the indicated years according to the Nuclear Energy Agency (NEA 2006).
In total, about 20 kt/yr of additional production capacity are expected by 2010. This would increase the present capacity from about 50 kt/yr to 70 kt/yr, enough to meet the current demand once the stocks are exhausted. However, it is very likely that new mining projects experience cost overruns and time delays which raises doubts whether the production capacities can be extended in time. These problems can be observed e.g. at the development of the Cigar Lake project which is supposed to produce about 8 kt/yr U3O8 (equivalent to 6.8 ktU) starting in 2007. In october a severe water inflow occured wholly flooding the almost finished mine. At present it is very unclear whether the project can be developed further (more details are given in Annex 8). The black line represents the uranium demand of nuclear reactors which in 2005 amounted to 67 kt.
The forecast shows the uranium demand until 2030 based on the forecast of the International Energy Agency in 2006 in its reference case (WEO 2006). Taking account of the uncertainty of the resource data it can be concluded that by between 2015-2030 an uranium supply gap will arise when stocks are exhausted and production cannot be increased as will be necessary to meet the rising demand. Later on production will decline again after a few years of adequate supply due to shrinking resources. Therefore it is very unlikely that beyond 2040 even the present nuclear capacity can still be supplied adequately. If not all of the reasonably assured and inferred resources can be converted into produced volumes, or if stocks turn out to be smaller than the estimated 210 kt U, then this gap will occur even earlier.
Now if you take into account that nuclear energy produces 16% of world electricity, and less than 5% primary energy supply, it seems impossible to me for nuclear energy with current technology to ever satisfy a big part of the world's energy demand.
This study may have flaws, but so far it is more convincing to me than the position of the nuclear industry, which regards Uranium as mineable without limits. If you believe some, we could mine it form the earth's crust, from sea water, ... or use breeders. And if all fails we have thorium. That is not serious. Being able to do it, even to technologically demonstrate it is not the same as doing it. We can extract gold from sea water too. While all those possibilities may be workable in the future, they could just as well not be viable. You cannot bet your energy future, the biggest investment society has to make, on such assertions. You may as well choose fusion.
There is a real posibility that Uranium supplies will not be sufficient for an expansion nuclear energy capacity and I am concerned that the reserve reporting practices could be too optimistic. Breeders, Thorium and such, whether workable or not are another matter not discussed here. I'll be glad if the members of the TOD community that evangelize nuclear fission step up to the challenge and criticize or outright debunk this study. That way, between all the highly educated people in the community we may even reach a conclusion on the Uranium resource question.
On a closing note, Raise The Hammer has posted an interview with Richard Heinberg, known for The Oil Depletion Protocol and his books The Party's Over and Powerdown, where he gives a hint about the second study of the Energy Working Group. Apparently they consider coal reserves to be as overestimated as Oil and Uranium reserves. Heinberg also states that he is tracking an independent Dutch study-in-progress reaching the same conclusions (for coal).
Ryan McGreal, Raise the Hammer: Coal is cheap and abundant. Other than the fact that it would increase CO2 production, can countries resist ramping up coal-to-liquids programs to replace declines in conventional oil?
Richard Heinberg: Actually, future global coal production is routinely overestimated. That, at least, is the conclusion of an as yet unpublished study by the Energy Watch Group of Germany. That team has found that in the countries where coal reserves are well reported, the size of resources has been downgraded dramatically in recent years. There are other countries that have not changed reserves reports for decades, and it appears that those numbers are probably even more inflated than oil reserves numbers for OPEC.
The study concludes that global coal production will peak in 10 to 20 years. I'm tracking a Dutch study-in-progress where the researchers are using different criteria, and their preliminary results confirm the German study.
All of this has enormous implications for the climate debate (which is mostly about coal) as well as discussions about substituting coal-to-liquids for diminishing oil. Ultimately we are facing not just a liquid fuels crisis, but a general energy crisis.
Miquel Torres has a degree in Physics from the University of Valencia, he currently lives in Germany and works in secondary education and in the field of energy investment.


Comment