Announcement

Collapse
No announcement yet.

Does the michigan housing survey predict a crash in the GDP?

Collapse
X
 
  • Filter
  • Time
  • Show
Clear All
new posts

  • Does the michigan housing survey predict a crash in the GDP?


    I think it's a convincing argument about the future of the GDP.

    What do you think?

  • #2
    Originally posted by blazespinnaker
    http://bigpicture.typepad.com/.share...ding_gdp_1.png

    I think it's a convincing argument about the future of the GDP.

    What do you think?
    The graph is a convincing argument given the information it conveys; however, I wonder what are the parameters that went into developing the data for the U of M survey?
    Jim 69 y/o

    "...Texans...the lowest form of white man there is." Robert Duvall, as Al Sieber, in "Geronimo." (see "Location" for examples.)

    Dedicated to the idea that all people deserve a chance for a healthy productive life. B&M Gates Fdn.

    Good judgement comes from experience; experience comes from bad judgement. Unknown.

    Comment


    • #3
      Originally posted by Jim Nickerson
      The graph is a convincing argument given the information it conveys; however, I wonder what are the parameters that went into developing the data for the U of M survey?

      How does Housing sentiment forecast GDP ?

      "The University of Michigan regularly surveys consumers on whether or not it is a “good time” to purchase a home. This survey attempts to gauge whether or not consumers feel (a) housing is a good investment, (b) housing prices are low and there are good deals available, (c) interest rates are low, and (d) times are good. The index has ranged from 53 (low) to 87 (high) over the past eighteen years and is currently at 57 indicating that consumers do not feel it is a “good time” to buy a house. This is likely due to high home prices and rising interest rates as well as a growing belief that housing is unlikely to be a good investment going forward. Interestingly, the University of Michigan survey on housing tends to lead U.S. economic growth by a few quarters (chart above). The sharp deterioration in this survey from 75 early last year to 57 now suggests the U.S. economy should start to slow soon."

      Comment


      • #4
        ecri's leading index deteriorating

        i believe ecri has the best record around for predicting the course of the economy. their wli [weekly leading index], leads the economy by roughly 6mos. from yesterday's ecri release:

        "With WLI growth falling to a 29-week low, U.S.
        growth outlook has clearly dimmed."

        Comment


        • #5
          Yeah, there are some great propietary institutions.

          Any free charts / links you can share with the community regarding ecri?

          Comment


          • #6
            Originally posted by jk
            i believe ecri has the best record around for predicting the course of the economy. their wli [weekly leading index], leads the economy by roughly 6mos. from yesterday's ecri release:

            "With WLI growth falling to a 29-week low, U.S.
            growth outlook has clearly dimmed."
            Thanks for that data, sure makes more sense than what I'd heard elsewhere about what ECRI was saying.

            My own work is definitely showing a slowing dead ahead.


            Its also showing a resurgence in inflation ahead.

            http://www.NowAndTheFuture.com

            Comment


            • #7
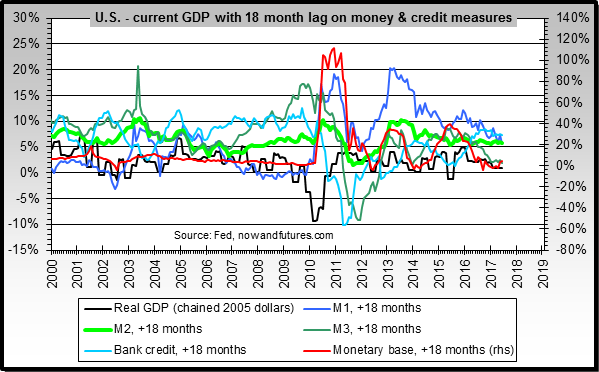
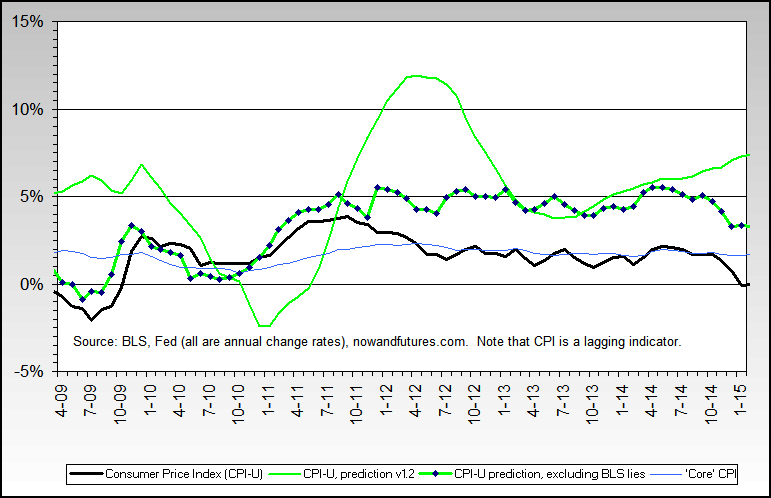
              "real" gdp and cpi lies

              bart, i'm curious about the two graphs you just posted. in the first you graph "real gdp" and your projection for it. i was going to ask you what you thought about john williams' work at shadowstatistics.com, but the answer was clear in your second graph, where you show "cpi without the lies." but if cpi-without-the-lies is as high as you show [and i agree it is] then isn't real gdp ALREADY negative?

              Comment


              • #8
                Originally posted by jk
                bart, i'm curious about the two graphs you just posted. in the first you graph "real gdp" and your projection for it. i was going to ask you what you thought about john williams' work at shadowstatistics.com, but the answer was clear in your second graph, where you show "cpi without the lies." but if cpi-without-the-lies is as high as you show [and i agree it is] then isn't real gdp ALREADY negative?
                I have nothing but the greatest respect for John Williams' work, and that second graph is based on numbers he has made public over the years. I was trying to do my own work until I ran into his data last year and am more than happy to take his data and numbers.

                Very much so on GDP too, I had expected a recession to start mid-late 2005 (a little later than John) and it was the primary reason I missed the first part of the gold move from $450-$500. I estimate that corrected GDP is around -2% now.
                http://www.NowAndTheFuture.com

                Comment

                Working...
                X